
Availability
StackAdapt is a programmatic advertising platform that enables marketers to plan, execute, and optimize campaigns across native, display, video, connected TV, and other digital channels. It provides detailed insights into campaign performance, audience engagement, conversions, and ad spend, helping teams measure impact and refine their media strategies based on real-time performance data.
If your credentials don't include full access to the data source, make sure your access level meets any permission requirements listed in the Specification section of the integration's page in the Metric Library.
- Contact your StackAdapt Customer Success Manager to request an API key.
- Specify which type of key you need:
- GraphQL API key — Use this if you plan to create and use datasets.
- REST API key — Use this if you plan to use native StackAdapt metrics.
- Copy the API key and store it securely. You will enter it in Databox.
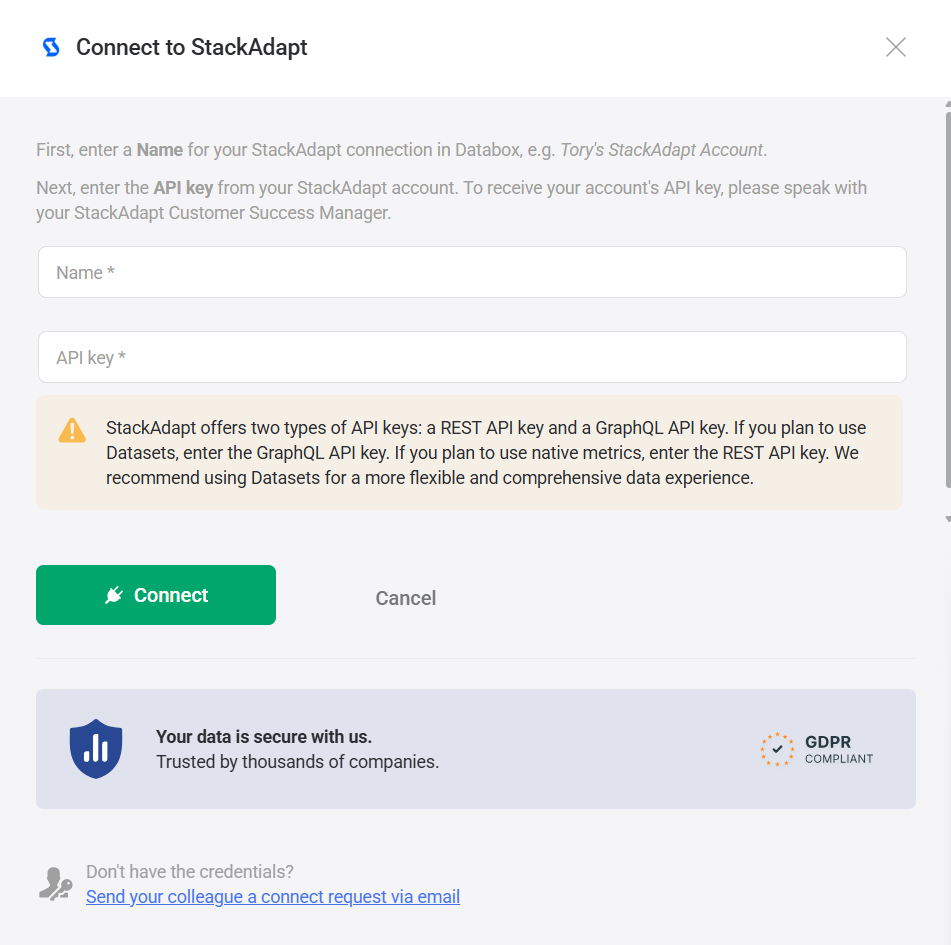
To connect StackAdapt to your Databox account for the first time or with new credentials, follow these steps:
- In Databox, enter a Name for your connection (for example, “StackAdapt - US Account”).
- Paste your API key into the API key field.
- Click Connect.
If the credentials are valid, the connection will be successfully added to your account.

The StackAdapt integration supports the creation of datasets, which allow you to structure and format your StackAdapt data for more flexible reporting in Databox. By organizing your data into a tabular format, datasets make it easier to filter, segment, and visualize key metrics across projects, clients, and team members.
The entity relationship diagram (ERD) below illustrates how data is organized within the StackAdapt integration, displaying the available views and columns, as well as the relationships between them (primary and foreign keys). This diagram represents the schema, or structure, of the data and helps you understand the underlying data model. With this context, you can create datasets using the relevant views and columns to build custom metrics tailored to your reporting needs.
For comprehensive details on metrics, data availability, templates, specifications, usage guidelines, and other key information, refer to the resources listed below.


FAQ
Can I switch API key types later?
Yes. You can edit the existing connection or create a new one using a different API key type, depending on your reporting needs.


