
As businesses grow, they enhance their tech stack to support complex operations across sales, marketing, finance, and customer support. This complexity increases the need for granular data, as predefined metrics often fail to capture the nuances of evolving use cases.
Datasets address this need by offering structured access to raw data. They enable businesses to build custom reports, filter data, and uncover insights across multiple sources. By working with datasets, businesses can adapt their reporting as needs evolve, ensuring they have the right insights to support growth.
A dataset is a custom table of data, where each row represents an individual record from the data source, and each column defines a specific field or attribute associated with that record.
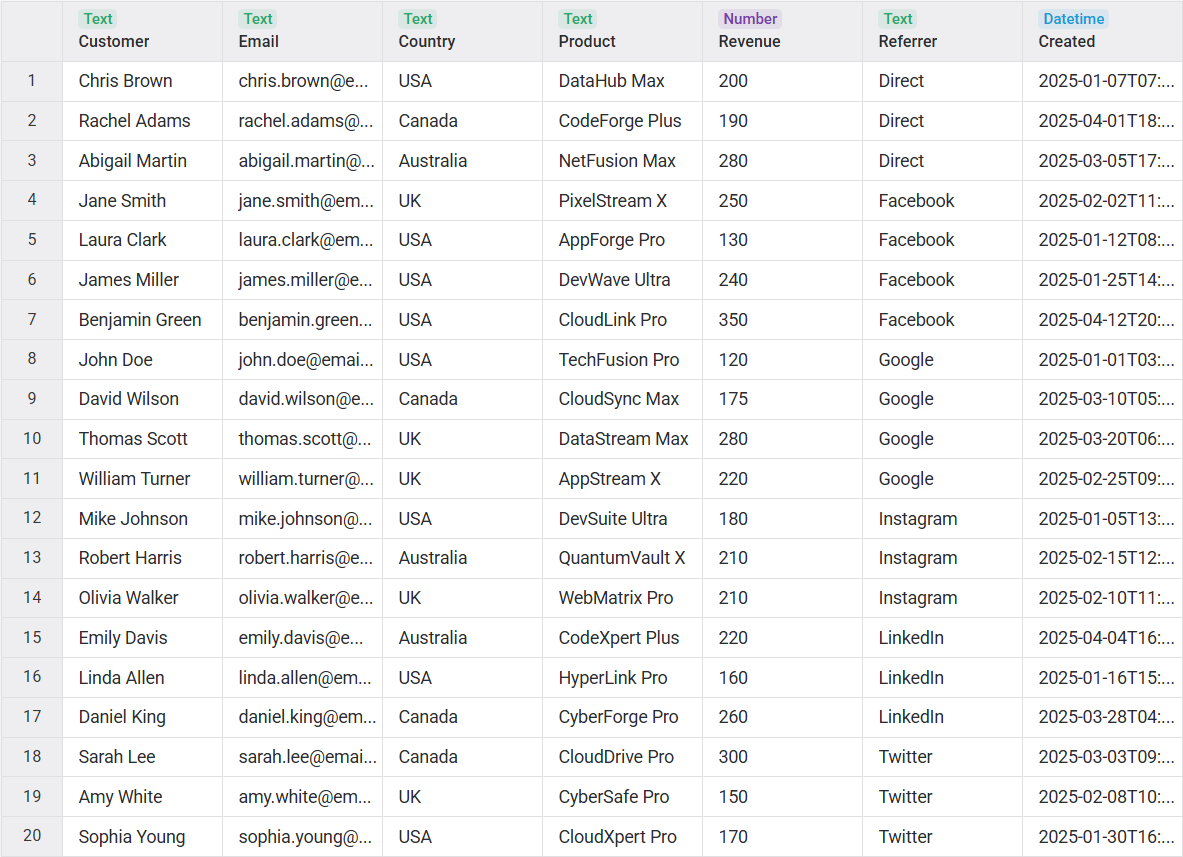
The data for these tables is sourced from raw data collected through supported integrations and organized into predefined views and columns, which can be easily selected with just a few clicks when curating your dataset.
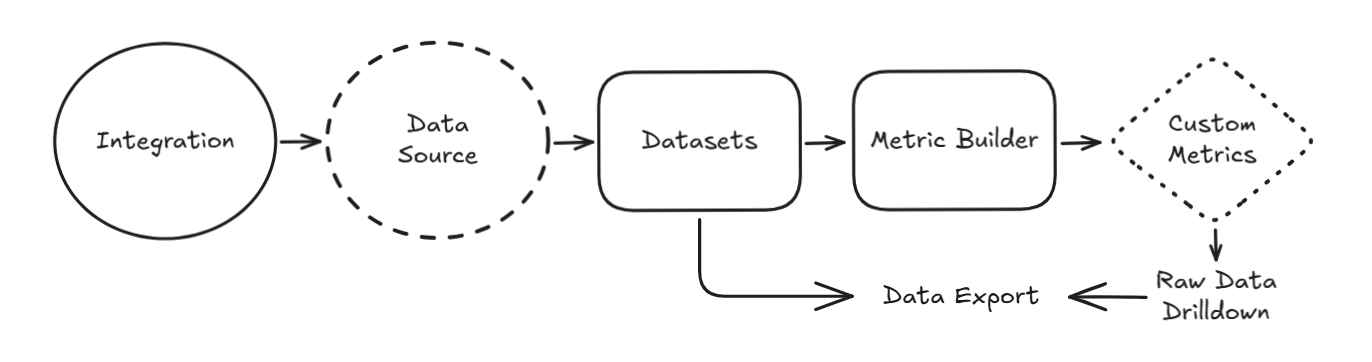
Once a dataset is created, it can be exported for external use or used to create custom metrics via the metric builder. The data movement flow is then as follows:
- One or more data sources are added through an integration.
- One or more datasets are created from a data source.
- Datasets can be exported as-is or used to create custom metrics via the metric builder.
Databox offers a wide range of pre-built metrics that match the values displayed in the data source interface. These metrics provide a solid foundation for analysis and reporting. However, they may not cover every possible use case. Given the vast number of potential scenarios and the specific needs of different users, it is impractical to provide pre-built metrics for all situations.
To address this, datasets act as flexible building blocks for creating custom metrics. They are particularly useful when a required metric is too specific, complex, or cannot be accurately calculated using simple sums or counts of records from the data source. By leveraging datasets, users can define custom structures that better align with their unique reporting and analytical needs.
Below are some common use cases where datasets can be leveraged:
- Filtered data views — When users want to create metrics based on a subset of data, such as transactions over a certain value or users from a specific region.
- Multi-step calculations — When a metric requires intermediate calculations or multiple data transformations before reaching the final value.
- Segmented data analysis — When users want to break down data into specific categories or segments that aren't available as standard dimensions in the data source.
- Combining multiple data points — When a metric depends on different attributes or measures that aren't directly available as a single field in the data source.
- Custom aggregations — When users need to apply specific aggregation methods beyond simple sums or counts (e.g., averages, min, max, etc.).
- Merging or joining data — When users need to merge related data from multiple views within a single data source (e.g., linking sales transactions with customer details) or combine data from different sources (e.g., blending CRM data with product analytics).
- Handling complex date ranges — When the data source provides raw time-based records, and users need to group them into custom periods (e.g., rolling 90-day windows or fiscal quarters).
- Niche or industry-specific metrics — When basic metrics don't align with a user's unique business model or industry-specific KPIs.
FAQ
Which integrations are compatible with datasets?
On the Data Manager > Available Integrations page, a blue  icon is displayed next to the name of integrations that support datasets. This information is also available on the integration's page in the Metric Library.

Why are some integrations incompatible with datasets?
Some providers deliver analytical data through predefined metrics, which typically consist only of dates and numerical values. These metrics lack the underlying raw records necessary for more detailed and customizable reporting. Furthermore, some providers anonymize or aggregate their data to such an extent that it becomes difficult, if not impossible, to break down, filter, or merge with other data sources.
To provide the best reporting experience, we prioritize developing integrations that offer flexible and granular data. This approach enables users to analyze data independently or combine it with data from other sources. By focusing on data that retains its detail and structure, we ensure that datasets remain valuable for generating meaningful insights and creating custom metrics.


