


Whether you're exploring what data you can pull from a new integration or trying to understand why a metric behaves a certain way, the Metric Library is your starting point. It's a centralized catalog of every integration and basic metric available in Databox, with detailed technical specifications, usage guidelines, and quick access to the tools that let you act on your data.
Navigate to Reporting & analytics > Metrics > Metric Library.
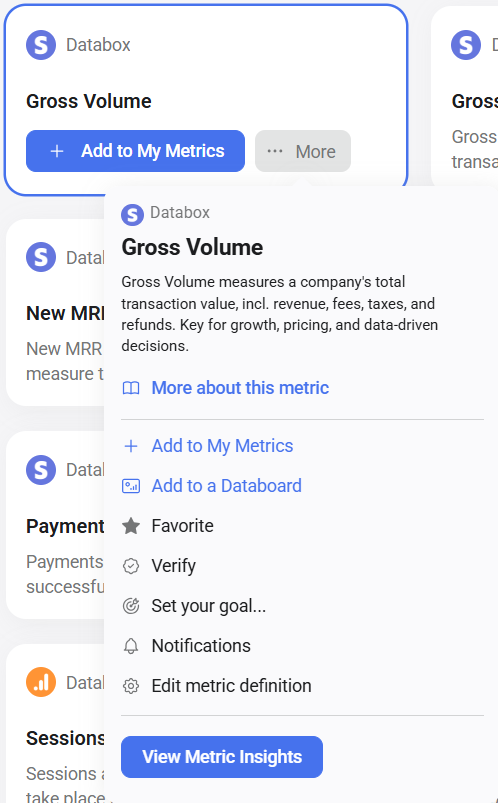
The in-app Metric Library shows individual metric cards. Click ... More on any metric card and select More about this metric to open its full details. See Metric pages below.
Visit databox.com/metric-library to browse the Metric Library without logging in.
The website version organizes content by integration. Search for an integration or browse the Popular Integrations section to open an integration page. From there, navigate to individual metric pages via the Metrics & Templates tab.
Integration pages provide detailed information about a specific integration — the external platform from which Databox pulls data.
Access an integration page by searching for the integration name in the Metric Library, or by browsing the Popular Integrations section on the main page.
Each integration page includes the following tabs:
- Metrics & Templates — all pre-built metrics and dashboard templates available for the integration. Click any metric to open its metric page.
- Technical Details — specification information about how the integration is configured, what it supports, and how it connects to the data source.
- Behavior & Usage — information collected over time about how the integration behaves, typically related to connection reliability and data availability.
- Handling Errors — guidance on how to avoid or resolve errors that can occur during connection, metric creation, or data sync.
- Help Articles — a curated list of relevant help articles for the integration.
| Field | Description |
|---|---|
| Description | A brief description of the integration or how it is publicly recognized. |
| Categories | The industry or domain the integration is most commonly associated with. |
| Status | Whether the integration is Stable or in Beta. |
| Connection Information | The message displayed at the top of the connection dialog when connecting this integration. |
| Connection Link | The link shown alongside the connection information in the connection dialog. |
| Date Added | The date the integration was first made available in Databox. |
| Field | Description |
|---|---|
| API Version | The version of the API that the integration is designed to work with. |
| API Documentation | A link to the integration's official API documentation. |
| API Change Log | A link to the integration's release notes or changelog. |
| API Status Page | A link to the integration's system status or uptime monitoring page. |
| API Marketplace | A link to Databox's app listing within the integration's marketplace. |
| Authentication Method | The protocol used to authenticate API requests on behalf of the user (e.g., OAuth, API key, Basic Auth). |
| Authentication Scope(s) | The scopes requested during the authorization process, typically used in OAuth-based integrations. |
| Shareable Connection | Whether the connection to this integration can be shared with other users in the account. |
| Pagination Limit | The maximum number of pages paginated through when fetching data for any metric. |
| Time Zone | The time zone in which the integration reports data. This may be fixed or vary based on user or source settings. |
| Datasets Available | Whether the integration supports the Datasets functionality. |
| Datasets Schema (ERD) | A link to the integration's entity relationship diagram, showing all available views and columns. |
| Media Creatives Available | Whether the integration supports workflows for retrieving and displaying media creatives (e.g., ad images). |
| Metric Builder Available | Whether the integration supports the metric builder for creating custom metrics. |
| Minimum Sync Frequency | The fastest sync frequency supported by the integration. |
| Required Permissions | The roles, scopes, or access levels needed to successfully connect the integration and retrieve data. |
| Data Source Scope | The level or entity within the external platform that the integration connects to (e.g., hub, property, account, or store). |
The Metric Builder section summarizes how metrics are built and what capabilities are available when using the metric builder for this integration.
| Field | Description |
|---|---|
| Metric Type | The category that describes how metric data is received and calculated. See Metric types below for definitions. |
| Granularities Available | The time granularities supported when building metrics (e.g., daily, weekly, monthly). |
| Custom Relative Periods | Whether Last X … date ranges (e.g., Last 14 Days) are supported. |
| Data Availability | The time period for which data can be retrieved during each sync. |
| Retroactive Data Updates | Whether previously synced data is replaced at every sync, or whether new data is merged with existing records for matching periods. |
| Future Data Available | Whether Next … date ranges (e.g., Next 7 Days) are supported. |
Metric pages provide detailed information about a specific metric, including a description, technical specification, and behavioral notes.
Access a metric page from the in-app Metric Library by clicking ... More on any metric card and selecting More about this metric, or from the website by clicking any metric in an integration's Metrics & Templates tab.
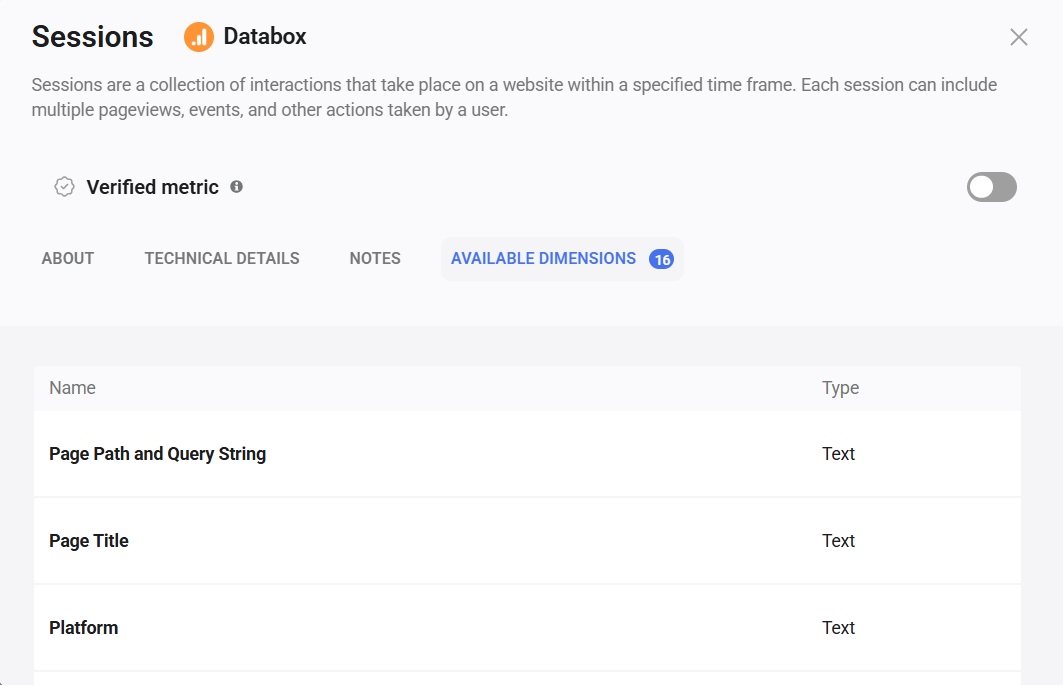
Each metric page includes the following tabs:
- About — a description of the metric, what it measures, and a usage example.
- Technical Details — specification information about how the metric is calculated, what data is available, and how it is displayed.
- Notes — information collected over time about how the metric behaves, typically related to data availability, sync behavior, or known data discrepancies.
- Available Dimensions (in-app only) — a list of dimensions that can be applied to the metric to segment data (e.g., by page, country, or device).
| Field | Description |
|---|---|
| Description | A brief description of the metric or how it is publicly recognized. |
| Category | The industry or domain the metric is most commonly associated with. Used in AI and data science functionality. |
| Subcategory | A more specific classification within the category. Also used in AI and data science functionality. |
| Date Added | The date the metric was first made available in Databox. |
| Field | Description |
|---|---|
| Metric Type | The category that describes how metric data is received and calculated. See Metric types below for definitions. |
| Source Metric | For calculated metrics only: the metric used as the base for the calculation. |
| Dimensional | Whether the metric supports segmentation by dimensions. |
| Minimum Value | The minimum value possible for the metric (e.g., 0 for metrics that can only be positive). |
| Maximum Value | The maximum value possible for the metric. |
| Decimal Digits | Whether the metric supports decimal (float) values. |
| Currency Units | Whether the metric has associated currency or unit formatting. |
| Granularities | A list of time granularities supported by the metric (e.g., daily, weekly, monthly). |
| Custom Relative Periods | Whether Last X … date ranges (e.g., Last 14 Days) are supported. |
| Data Availability | The full time period for which data can be retrieved during each sync. |
| Retroactive Data Updates | Whether previously synced data is replaced at every sync, or whether new data is merged with existing records for matching periods. |
| Future Data Available | Whether Next … date ranges (e.g., Next 7 Days) are supported. |
| Metric Value | The API response field or calculation formula used to derive the metric value. |
| Metric Date | The API response field used to determine the date associated with each metric value. |
| Field | Description |
|---|---|
| Default Format | The number format applied to the metric by default (e.g., integer, percentage, currency). |
| Cumulative Graph | Whether the metric can be displayed as a cumulative graph. |
| Favorable Trend | Whether higher values are considered better or worse for this metric. |
| Media Creatives | Whether images (e.g., ad creatives) are available for visualization alongside this metric. |
Every metric in the Metric Library has a Metric Type that defines how data is received, stored, and calculated. There are four types:
- Current — data is received as a single number representing the all-time cumulative value. The displayed value is the most recent data point within the selected date range.
- Event — data is received as individual entries for each instance of an event. Databox stores each entry separately and calculates the total for any selected date range and granularity.
- General — data is received and stored in predefined time periods (typically daily). The displayed value is calculated by aggregating the relevant entries within the selected date range.
- Calculated — the metric cannot be directly obtained from the API. Its value is derived by calculating the difference between two consecutive values from a paired
currentmetric.


