
An Entity Relationship Diagram (ERD) — also referred to as a schema — is a visual representation of how data is structured within a system. It defines the data objects (called entities), the properties they contain (called fields), and the relationships between them. ERDs help clarify how data is organized and how different components connect to one another.
In Databox, the terminology differs slightly from standard database conventions: entities are referred to as views, and fields are called columns. A view represents a specific category of data, while columns represent the individual data points available within that view.
Understanding the integration's schema is a key step when building datasets, which serve as the source for creating custom metrics. The schema provides the necessary context to determine which views to use, how they relate to one another, and what data is available for analysis. The Databox Schema Explorer makes it easy to visualize and interact with your integration's data model.
Each integration's schema includes the following elements:
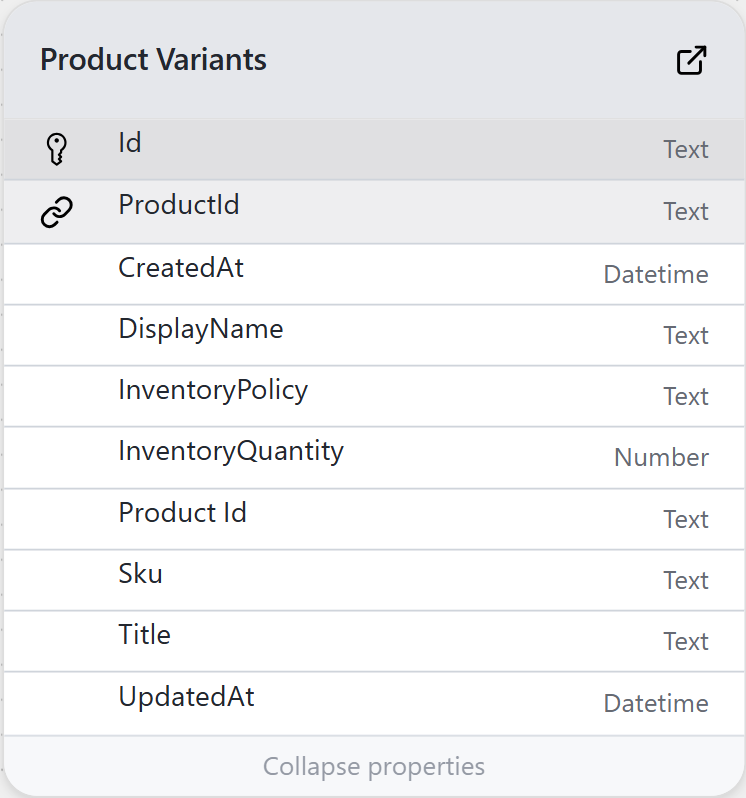
- Views: Represented as boxes, each view lists all available columns along with their data types, such as text, number, or datetime.
- Relationship arrows: These arrows show how views are connected through shared columns (keys).
- Primary keys (
 ): Unique identifiers within a view that can be used to join to other views.
 - Foreign keys (
 ): Columns in one view that reference primary keys in another view, enabling joins.
 - Columns: The individual fields available within each view.
- Reference (
 ): A link to the API provider's documentation related to the view for further details.
The diagram currently does not display cardinality information (such as one-to-one or one-to-many relationships).
When building a dataset, the schema helps you structure your data effectively. Here's how to use it:
- Choose the starting view — Begin with the view that contains the core data you want to analyze or measure.
- Add related data — Use the relationships shown in the schema to identify which views can be joined, and include additional columns as needed.
- Verify field availability — Confirm that the columns you need are present in the schema and that they can be linked through valid join conditions.
- Understand how data fits together — The schema provides a visual overview of how views are connected, which is especially helpful when combining columns from multiple views or troubleshooting unexpected results.
FAQ
Can I export or save the schema?
The Schema Explorer is view-only and not exportable, but you can keep the tab open while building your dataset, or take screenshots for reference.
Can I use columns from multiple views in one dataset?
Not directly. To use columns from multiple views, create a separate dataset for each one. Then, combine them using a merged dataset — as long as the views are connected in the schema by a shared column that can serve as a join condition.
What is the difference between the Schema Explorer and the Metric Library?
- The Metric Library lists predefined metrics and dimensions available out of the box.
- The Schema Explorer shows the raw data model — useful for building datasets, which are then used to create custom metrics.
Why don't I see certain columns or views?
Only entities exposed by the integration's API are shown. If something appears to be missing, it may not be available through the integration's API or may not yet be supported in Databox.


