Filtering helps you narrow down large amounts of data so you can focus on what is relevant to your analysis. By applying filters, you can exclude unnecessary information, isolate specific segments, and better understand patterns or performance.
Different filtering methods can affect data at different stages of the analysis process, from limiting the underlying data to controlling what appears in a visualization.
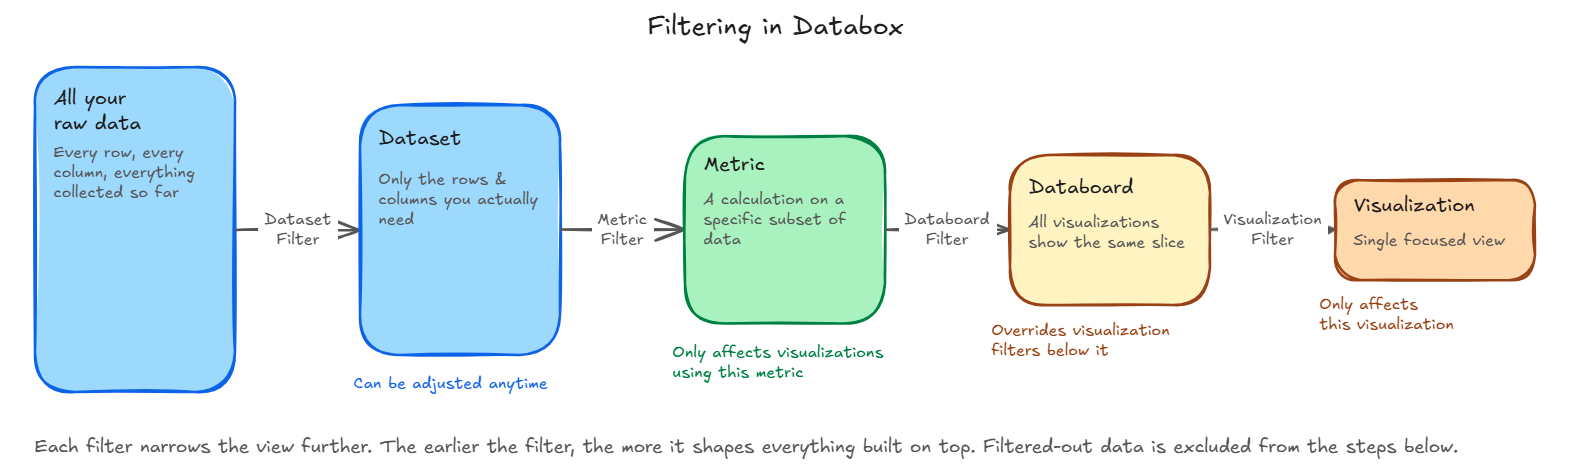
In Databox, filters can be applied at several levels depending on how broadly you want the filter to apply. You can filter data in datasets, metrics, Databoards, and visualizations.
Each level affects a different part of the reporting process, from limiting the data included in a dataset to narrowing down the data used in a metric or analysis.

When creating a dataset, you can limit the data available for analysis by selecting only the columns you need. This helps focus your dataset on the most relevant data and reduces unnecessary complexity.
For detailed instructions, see Create a dataset.
Dataset filters restrict the records stored in the dataset. All metrics and visualizations built from the dataset use the filtered data.
- Go to Data Manager > Datasets.
- Locate dataset you want to edit and click the down arrow (
 ) to open the dataset options menu.
 - Select Edit data.
- Locate the column you want to filter and click the down arrow () to open the column options menu.
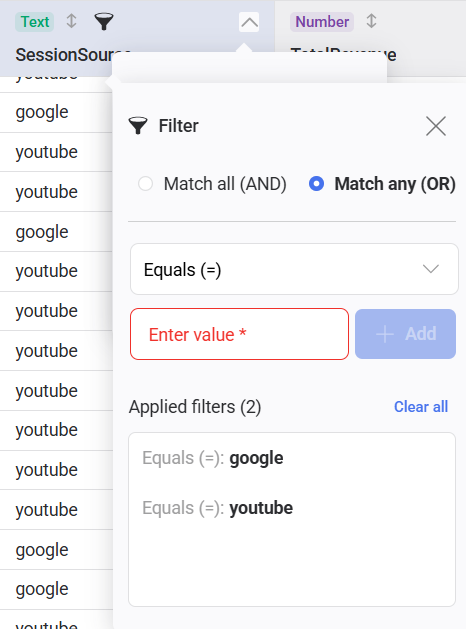
- Select Filter.
- Select the operator.
- Enter the value if required.
- Click Add.
Custom metric filters define which records are included in the metric calculation. Any visualization that uses the metric will reflect these filters.
- Go to Metrics > Custom Metrics.
- Click + Custom metric, or open an existing custom metric.
- Configure the metric fields.
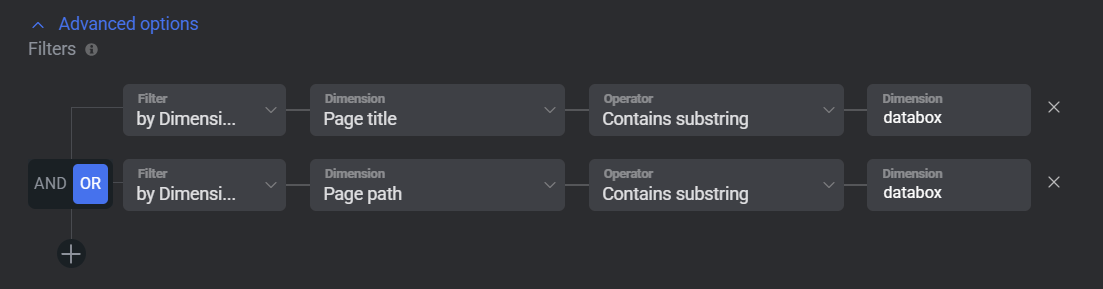
- Click Advanced Options.
- Under Filters, select a Column, Operator, and Value.
- Click + to add more filters.
- Click Preview data to verify the results.
- If everything looks correct, click Save.
Databoard filters allow you to apply a filter across multiple visualizations at once.
- Open the Databoard.
- Click Filter data in the toolbar at the bottom of the Databoard.
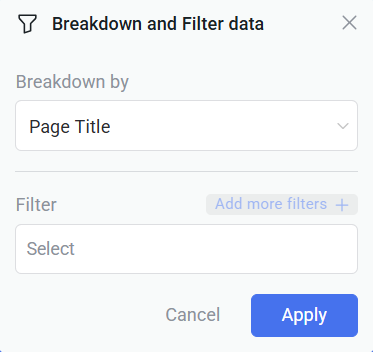
- Select the dimension or column you want to filter by.
- Select the operator and enter one or more values.
- Click Add more filters + to apply additional filters if needed.
- Click Apply when you are satisfied with the results.
You can filter the data shown in a visualization to focus on a specific subset of data.
To filter in a visualization:
- Open the Databoard in the Designer.
- Click on the visualization to open the Datablock editor.
- Expand the metric you want to filter.
- Under Filters, click + or the filter selector.
- Add one or more filters to define which data should be included in the metric.
- Click Apply.
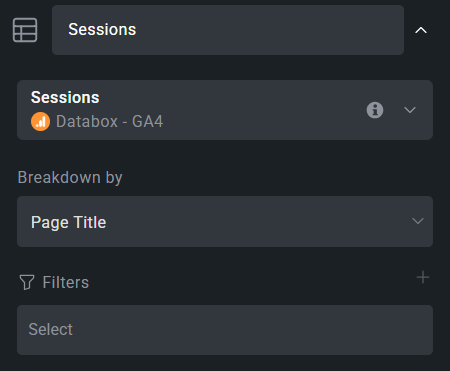
Breaking down data by dimension splits a metric into categories based on a selected dimension. This allows you to compare how the metric performs across different segments of your data.
For example, you can break down revenue by campaign, region, or product to see how each category contributes to the total value.
To break down data in a visualization:
- Open the Databoard in the Designer.
- Click the visualization to open the Datablock editor.
- Expand the metric you want to analyze.
- Under Breakdown by, select the dimension you want to use.
FAQ
Which filtering method should I use?
The best filtering method depends on where you want the filter to apply and how broadly it should affect your analysis.
Use:
- Dataset filters to restrict the underlying data used in analysis
- Metric filters to control which data is included when a metric is calculated
- Databoard filters to apply filters across multiple visualizations at once
- Visualization filters to analyze specific subsets of data in a single visualization
- Breakdowns to split a metric into categories based on a selected dimension
Why are filtering options different for some metrics?
Available filtering options depend on the source of the metric.
For metrics created from datasets, you can filter by any column that was included as a dimension when creating the metric.
For other metrics, filtering behavior depends on the capabilities of the API provider. In some cases, you must first select a breakdown dimension before filtering becomes available. In other cases, filtering may not be supported due to limitations of the provider's API.
Why are some values missing when breaking down a metric by a dimension?
When you break down a metric by a dimension, values with no associated metric activity (0 values) may not appear in the results.
Some integrations return data that is already aggregated by the provider's API. If a dimension value has no recorded metric value within the selected date range, the API may omit it from the response entirely instead of returning it with a value of 0. As a result, those dimension values will not appear in the breakdown.
For example, when breaking down Impressions by Campaign, campaigns that received 0 impressions during the selected date range may be omitted from the results. The Campaign dimension itself is still available, but only campaigns with at least one recorded impression will appear in the breakdown.


