
Datasets provide a structured way to store and manage data, ensuring that only the most relevant and valuable information is included for reporting. By curating datasets to focus on key metrics and dimensions, you can gain deeper insights, track performance more effectively, and customize visualizations to align with your specific business needs. Whether you're working with manually uploaded data or integrating with external sources, datasets give you greater flexibility and control over how your data is used in Databox.
You can create a dataset from the following locations:
- Data Manager > Datasets → Click + New Dataset
- Account Management > Data Manager > Datasets → Click + Add Dataset
After selecting an existing data source or adding a new one, the dataset setup window will open. In this window, you'll first need to select the data to include in the dataset, and then specify its data update frequency.
In this stage, you will choose the view and associated columns to be included in your dataset.
- Views: These are categories of data that typically correspond to specific objects, modules, or components within your data source. Examples include:
- Deals (HubSpot)
- Orders (Shopify)
- Subscriptions (Stripe)
- Invoices (QuickBooks)
- Columns: These refer to the individual fields or attributes within each view. For instance:
- Deal Amount (HubSpot)
- Order Date (Shopify)
- Customer Email (Stripe)
- Invoice Balance (QuickBooks)
If you are working with a compatible SQL integration, you can also enter a custom query, and its output will be used to create the dataset. This approach is advisable when more complex transformations are necessary to generate the desired dataset.
Next, you'll select how often Databox should refresh the data in the dataset. The available synchronization frequencies depend on the technical capabilities of the chosen integration and your account subscription.
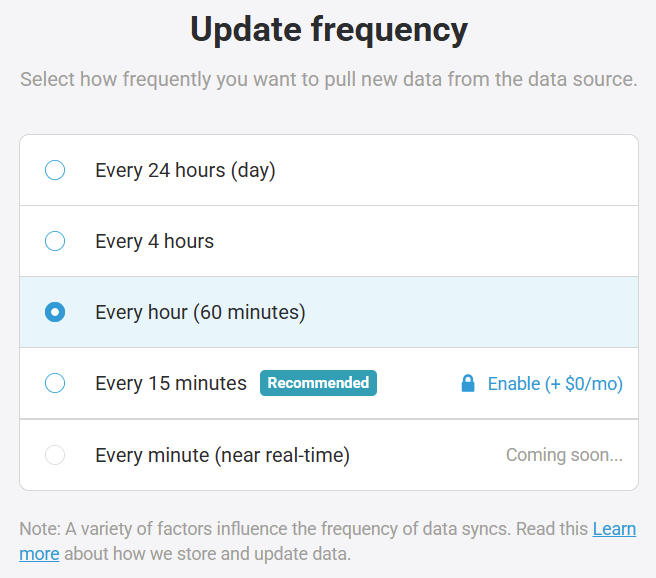
Once you've chosen the desired frequency, click Save to finalize the setup and initiate a full synchronization of the selected view and columns in the backend.
To ensure your dataset includes all relevant data for reporting:
- Define key metrics and insights the dataset should support.
- Identify critical data points needed to calculate those metrics, including:
- Relevant measures (e.g., sales, revenue, conversions).
- Dates for tracking trends over time.
- Dimensions for segmenting data (e.g., region, product category).
- Additional data necessary for drill-down or deeper analysis.
It's equally important to ensure the dataset captures granular data where needed while excluding unnecessary fields that could add complexity without contributing value. By focusing on the right data, you can ensure the dataset remains both comprehensive and efficient for reporting purposes.
To modify your dataset, click Edit Data in the view mode. Then, click the down arrow (![]() ) next to a column name to access the actions menu. The following options are available:
) next to a column name to access the actions menu. The following options are available:
- Set data type: Choose a new type for the column if there is a mismatch or conversion is needed.
- Filter: Add one or more filters to include or exclude specific rows.
- Insert column left: Add a new calculated column to the left of the selected column.
- Insert column right: Add a new calculated column to the right of the selected column.
- Hide: Remove the column from view within the app without deleting it.
You can also rename columns by clicking the column name box and entering a new name.
Once you're satisfied with your changes, click Save in the top-right corner of the screen.
FAQ
Can multiple datasets be merged or combined into a single dataset?
Yes, it's possible to combine multiple datasets into one, provided they have at least one column with matching values. For more details, refer to this article.
Can I combine AND and OR filters on a dataset column?
No, only one filter type (either AND or OR) can be applied to a column at once.
How much data can a dataset contain?
Each dataset can hold a maximum of 100 columns, and its total size cannot exceed 200MB.


