
Legacy SQL, spreadsheet, and Legacy API (v0) metrics are being deprecated. The in-app migration tool re-creates each one as a dataset-based metric, checks that the migrated data matches the original, and repoints every reference across your dashboards, reports, and calculated metrics, so nothing breaks.
Jump to the workflow for your metric type:
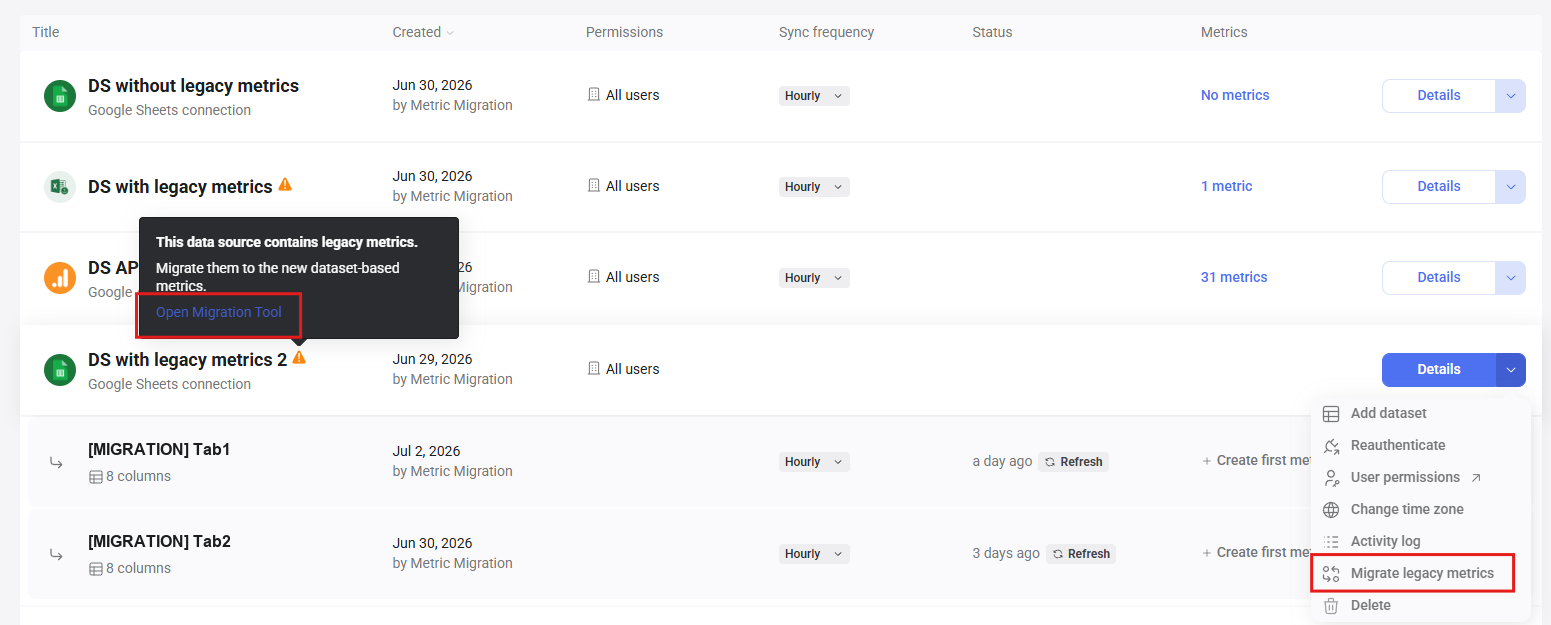
In the Data Manager, any data source with legacy metrics is marked with a warning triangle. Open the migration modal in one of two ways:
- Hover the warning triangle and click the link in the tooltip.
- Click the drop-down arrow (
 ) next to the data source and select Migrate legacy metrics.
The tool opens as a short, guided wizard, already showing the legacy metrics for the data source you chose. From there (or from the Data Source step first, if you arrived via a direct link) you select the metrics to migrate, review the proposal, run the migration, and replace the old references. Legacy API (v0) sources add an extra Update Code step before Replace.
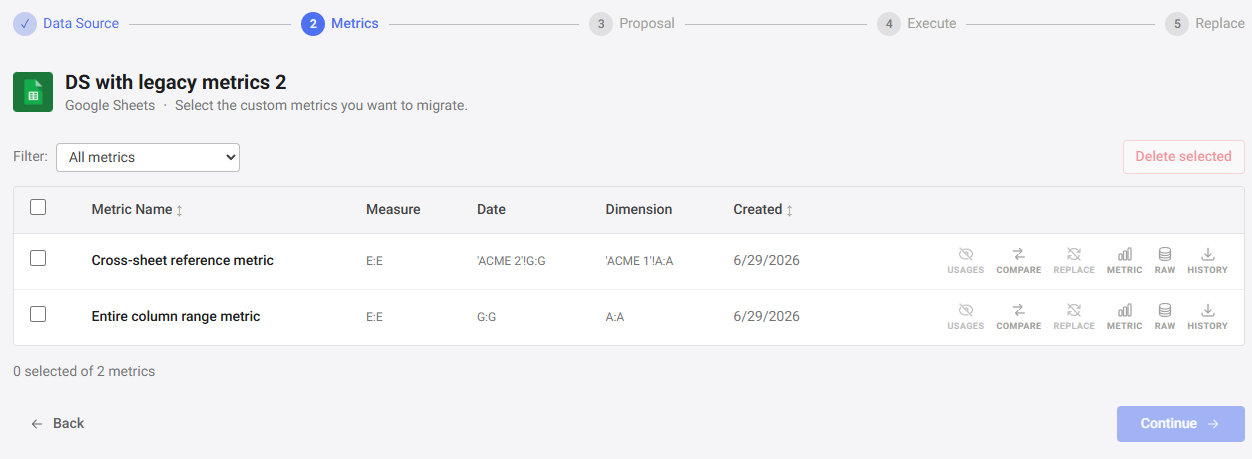
The Metrics step is the heart of the tool and works the same way for all three metric types, so the workflows below refer back here. The header shows the data source name, its type, and the subtitle Select the custom metrics you want to migrate.
Select the metrics you want with the row checkboxes (or the header checkbox to select all visible rows), then click Continue to move to the Proposal step.
Use the Filter dropdown to narrow what's shown:
- All metrics
- Metrics with usages: metrics used somewhere (dashboards, reports, etc.)
- Metrics without usages
- Migrated metrics: already migrated (name begins with
[MIGRATED]) - Replaced metrics: already replaced (name begins with
[REPLACED])
Each row has a strip of icons on the right. Each opens a tool for that metric; availability depends on the metric type.
| Action | Description | Metric types |
|---|---|---|
| Usages | Lists every place the metric appears, grouped by type (dashboards, reports, notifications, metric anomalies, forecasts, goals, and more), each with a count and an Open link that jumps to that specific item (dashboard, report, goal, team, and so on). A crossed-out eye means the metric has no usages. | All |
| Compare | Lets you pick a data source and metric to validate this legacy metric against. The tool checks the two across several date ranges and reports matches and mismatches. | All |
| Replace | Lets you repoint this metric's usages onto another metric. | All |
| Metric | Displays the processed data the metric returns (up to 200 rows). | All |
| Raw | Displays the underlying raw source rows behind the metric (up to 200 rows). | All |
| Code | The ingestion snippet for the metric, plus the option to back-fill its historical data. | Legacy API (v0) |
| History | Copies the metric's accumulated history into a new dataset so it's preserved. | SQL and spreadsheet |
Legacy spreadsheet metrics read values from a source document on every refresh. Migrating them to datasets loads the whole sheet once and lets you build many metrics, dimensions, and calculations on top of it. See Migrate from legacy spreadsheet metrics to datasets for the full rationale.
Select the spreadsheet metrics you want to migrate and click Continue. For columns, filters, selection, and the per-row icons on this screen, see Work in the Metrics step. For spreadsheet metrics, the Measure, Date, and Dimension columns show which cells each metric reads.
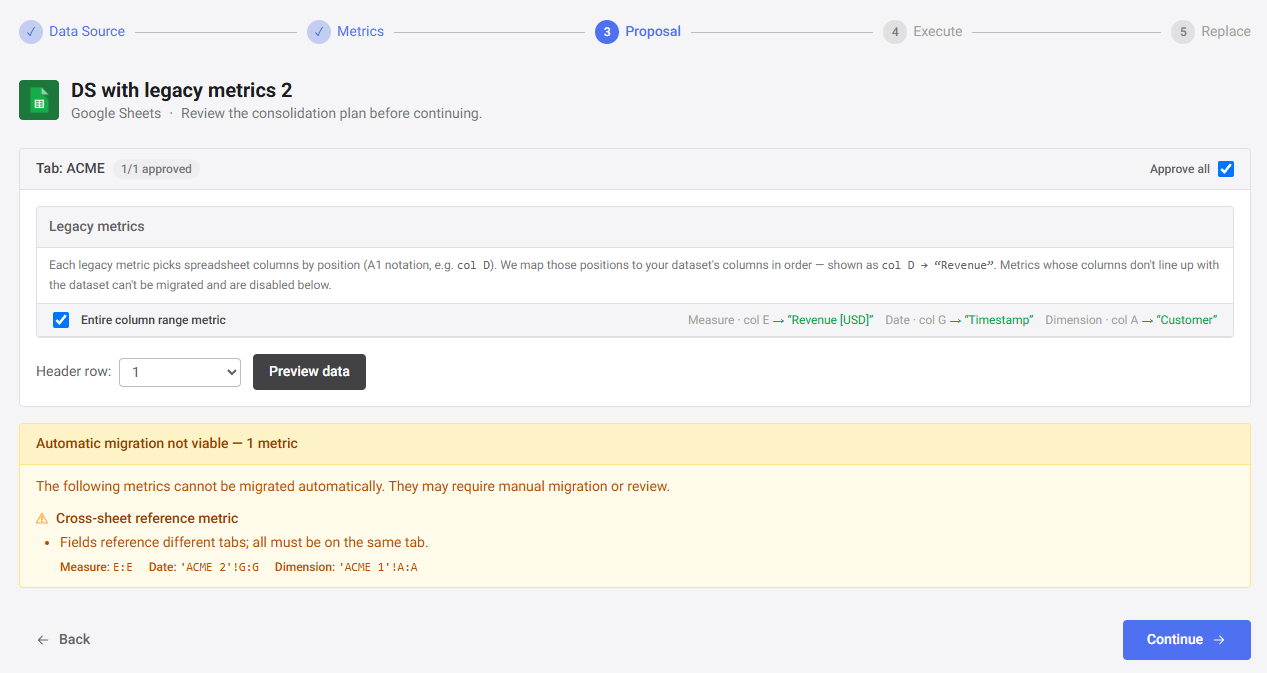
The tool groups your metrics by their source tab (one proposal group per tab). For each group:
- A Header row selector (0 for no header, or 1, 2, 3) tells the tool which row in the spreadsheet holds your column names. Choosing the correct header row determines how legacy metrics map to the new dataset columns and directly affects whether the migration succeeds. Changing it re-runs the preview.
- Each metric shows a live column mapping between the legacy metric and the new metric, for example Measure · col D → "Revenue". It turns green when the column resolves to a valid type and red when it doesn't.
- Click Preview data to see the resolved columns and sample rows (up to 200 rows).
- Use the Approve all checkbox, or the per-metric checkboxes, to choose what gets migrated. Uncheck anything you want to skip.
Metrics whose columns can't be mapped automatically are collected in an amber Automatic migration not viable list and aren't migrated automatically. You can handle those later using the row actions.
The migration runs automatically, showing one section per source tab, labeled by tab name (for example, Tab: Marketing Data), each with ordered steps and a status icon: Creating dataset → Setting up query → Waiting for dataset → Creating metric → Validating metric → Renaming legacy metric. The Validating metric step compares the new dataset metric against the original across several date ranges and reports how many data points match. The Renaming legacy metric step prefixes the original metric with [MIGRATED].
- Stop Migration halts the run; any in-progress step becomes a warning.
- Each finished section has a Rollback button that undoes it, deleting the new dataset and restoring the legacy metric's name.
When every section finishes, a green Migration Complete panel shows a table mapping each legacy metric to its new metric.
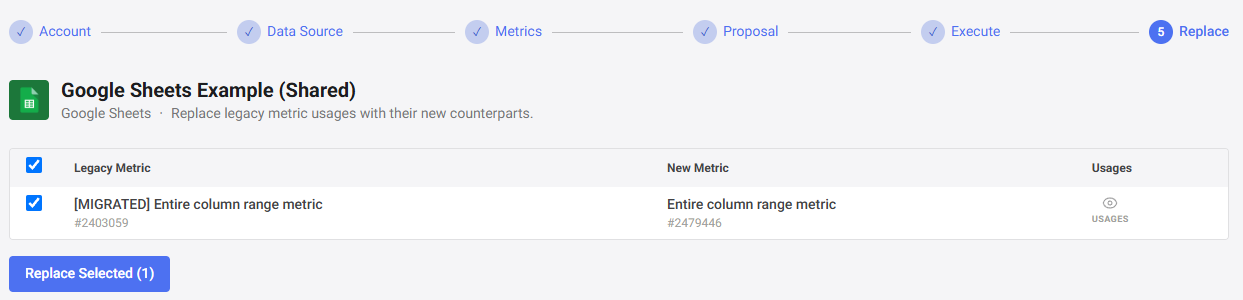
The Replace step repoints every usage of each legacy metric onto its new dataset-backed metric, then renames the legacy metric with a [REPLACED] prefix so it's easy to spot.
- Review the Legacy metric → New metric table. Each pair shows its Usages count, and metrics that have usages are pre-selected.
- To check where a metric is used first, click the Usages icon on its row.
- Click Replace Selected. For each pair, the tool re-checks usages, rewrites the references, and renames the legacy metric. A Stop All button is available while it runs.
- After a pair completes, you can click Rollback to undo it, or Delete legacy to remove the old metric permanently. Deleting asks you to type
DELETEto confirm.
Legacy SQL metrics run a separate database query for every metric on every refresh: 200 metrics means 200 queries each time data refreshes. With datasets, one query can power dozens or hundreds of metrics, cutting database load and speeding up refreshes. See Migrate from legacy SQL metrics to datasets for the full rationale.
Select the SQL metrics you want to migrate and click Continue. See Work in the Metrics step for the columns, filters, selection, and per-row icons. For SQL metrics, the SQL Query column shows each metric's query. Hover to see it in full.
The tool proposes how to consolidate your metrics into shared datasets, grouping metrics that a single query can serve. A green banner reports how the metrics were grouped. For each consolidation group:
- A Consolidated SQL Query editor shows the SQL that will define the dataset, which you can edit.
- Click Preview data to run the query and see up to 200 rows with column types.
- Use Approve all or the per-metric checkboxes to include or exclude metrics.
- Click Migrate individually to pull a metric out of a group into its own dataset, and Move back to group to undo. Individually migrated metrics appear in their own section, each with an editable query.
- A blue Existing dataset badge means a matching dataset already exists and will be reused instead of creating a new one.
Click Continue once at least one metric will be migrated and every group has SQL.
The Execute step behaves exactly as it does for spreadsheet metrics (see Run the migration). It works through Creating dataset → Setting up query → Waiting for dataset → Creating metric → Validating metric → Renaming legacy metric, with per-section status icons, Stop Migration, and Rollback. Reused datasets show Using existing dataset… instead of creating a new one.
The Replace step is also identical (see Replace references). Review the Legacy → New pairs, click Replace Selected, and optionally Rollback or Delete legacy afterward.
Legacy Legacy API (v0) metrics send pre-aggregated values to Databox. Migrating to the Databox API (v1) moves you to a dataset-based architecture that separates data ingestion from metric creation: you send raw records, then build metrics on top. See Migrate from Legacy API (v0) to Databox API (v1) for the full rationale.
Because you send data to Legacy API (v0) metrics from your own code, this workflow adds an Update Code step before Replace so your integration keeps sending data to the new dataset.
Select the Legacy API (v0) metrics you want to migrate and click Continue. See Work in the Metrics step for the shared behavior. A few things are specific to Legacy API (v0): the table shows only the Metric Name column, and each row has an extra Code action that opens Update client code for that single metric.
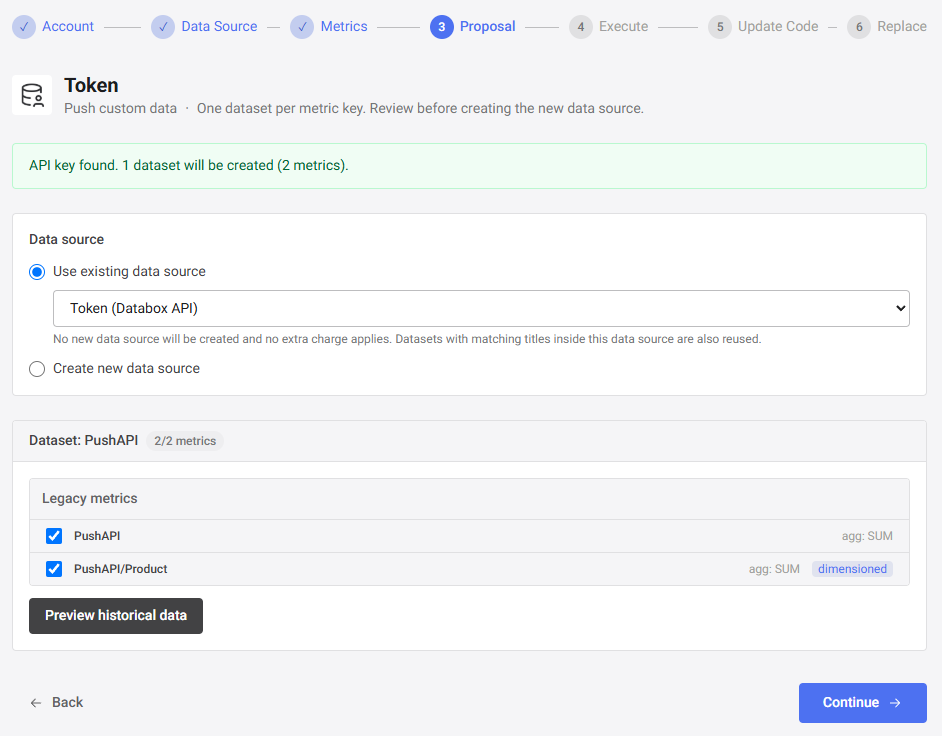
The tool creates one dataset per metric key.
- API key check: a green banner confirms an API key was found. An API key is required to migrate your historical data into the new ingestion dataset.
- Data source: choose where the new datasets live.
- Use existing data source: reuse a Databox API source already on your account (no new billed source).
- Create new data source: enter a New data source name and confirm that this creates a new, billed Databox API data source.
- Per-key dataset cards: one card per metric key. Each lists its legacy metrics (uncheck any to exclude) and a Preview historical data button showing the first 20 records that would be ingested.
Click Continue once the API key is present, at least one metric is included, and you've chosen (or named and acknowledged) a data source.

The migration creates (or reuses) the chosen Databox API data source, creates one dataset per metric key, and back-fills your historical data into each dataset. Progress shows as sections (Creating data source → Creating dataset → Waiting for dataset → Back-filling history → Waiting for ingestion → Finalizing → Creating metric → Validating metric → Renaming legacy metric), each with the usual status icons, Stop Migration, and per-dataset Rollback.
When it finishes, the green Migration Complete panel appears. Click Continue to move to Update Code.
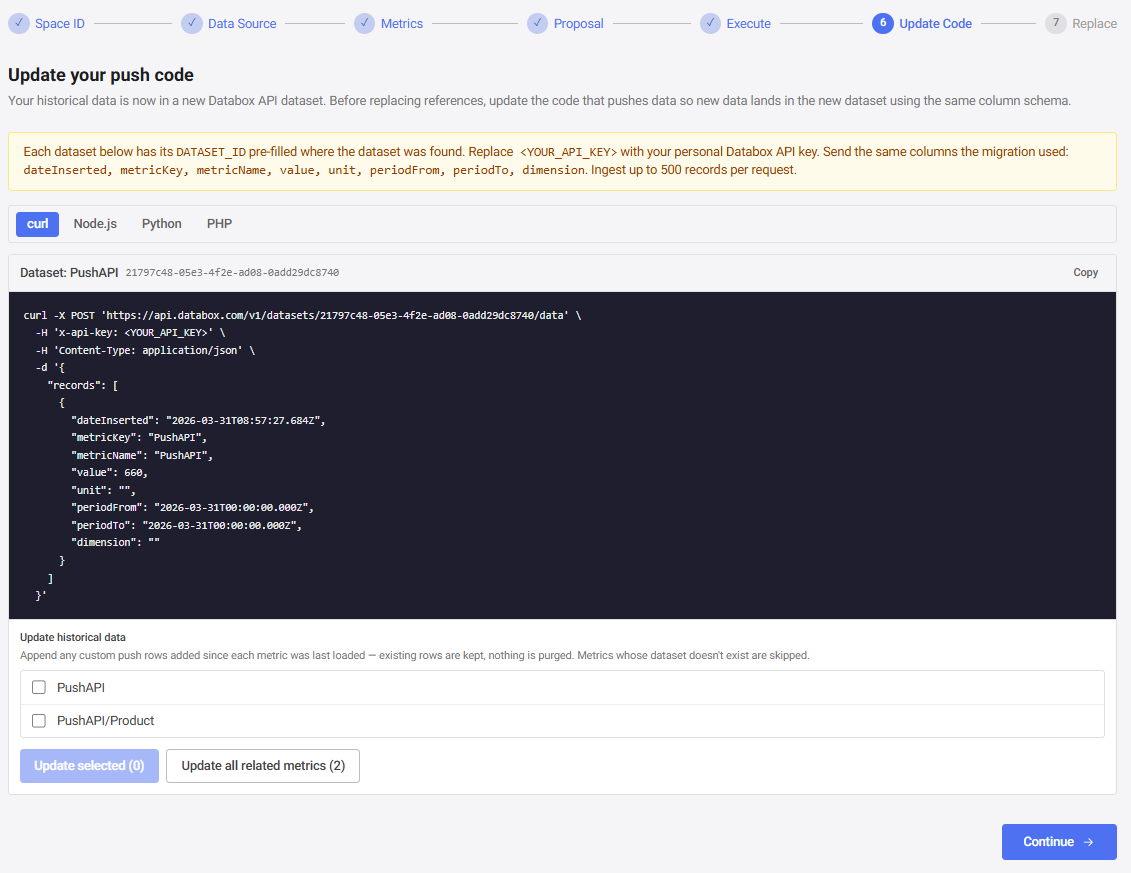
Your historical data is now in a new dataset, but your integration is still pushing to the old endpoint. This step gives you the code to point it at the new dataset.
- A language toggle switches the code snippet between curl and the other supported languages.
- Each dataset card shows the resolved DATASET_ID and a code snippet with a Copy button. In the snippet, replace
<YOUR_API_KEY>with your own Databox API key, send the same columns the migration used, and note that you can ingest up to 500 records per request. - The Update historical data panel lets you append any additional push rows for the chosen metrics: Update selected or Update all related metrics. Existing rows are preserved.
Once your code is updated, click Continue to reach Replace. This step is identical to the other workflows (see Replace references). Review the Legacy → New pairs, click Replace Selected, and optionally Rollback or Delete legacy afterward.
FAQ
Can I migrate my metrics in batches instead of all at once?
Yes, and it's a good idea to start small. Migrate a single metric or a small batch first so you can see the full flow (migration, validation, and replacement) and confirm the results. Once you're confident, select larger batches, or all metrics at once, with the row checkboxes, and use the Filter dropdown (including Migrated metrics and Replaced metrics) to track what's done and pick up where you left off.
What happens to my legacy metrics after they're migrated?
Migrating renames each one with a [MIGRATED] prefix; replacing its references then changes that to [REPLACED]. Either way they're easy to spot, and they stay in your account until you remove them. You can delete a legacy metric permanently from the Replace step, which asks you to type DELETE to confirm.
Will my dashboards and reports break during migration?
No. The tool re-creates each metric on a dataset and validates it against the original before the Replace step rewrites any references. You can review usages and roll back at each stage, so your content keeps working throughout.


