
The legacy Google Sheets and Excel metric builders are being deprecated, along with all metrics created using them. Spreadsheet-based reporting is being consolidated into datasets to provide a more scalable and reliable way to work with your data.
Legacy spreadsheet metrics sync by downloading your file and reading cell values for each metric. In some cases, Databox stores a local copy of the file, such as with Google Sheets. In other cases, the file must be downloaded at every sync for every metric. If you have 50 metrics, that means 50 separate file reads during each refresh. This increases processing time, raises the risk of sync failures, and makes maintenance more complex.
With Datasets, syncing is tied to the dataset instead of individual metrics. Your spreadsheet is processed once, and a single dataset can power dozens or even hundreds of metrics. This reduces sync load, improves reliability, and simplifies long-term management.
By migrating to datasets, you can:
- Reuse the same dataset across multiple metrics
- Analyze data across multiple dimensions
- Apply filters and drill-downs directly in visualizations
- Create custom calculated columns
- Merge datasets from multiple data sources
- Export raw data when needed
- Use AI-powered insights with Genie and Databox MCP
- Improve refresh performance and maintainability
Previously, you built metrics directly on top of your spreadsheet data sources. Each metric independently read data from the spreadsheet during sync.
Now, a data preparation step is introduced between your spreadsheet and your metrics. You first create a dataset from your spreadsheet, and then build metrics from that dataset.
One dataset can power multiple metrics, and a single sync refreshes all metrics built on that dataset. Column configuration and data structure are now managed within the dataset instead of inside the metric builder. The metric builder interface also reflects this updated workflow.
Your underlying spreadsheet data remains unchanged. Historical data, metric definitions, and existing content are preserved and remain accessible.
The biggest benefit of datasets comes from consolidating queries.
Instead of migrating each metric 1:1, look for patterns where multiple metrics query the same table with different filters.
Before migrating, take inventory of your spreadsheet-based metrics:
- Go to Metrics > Custom Metrics.
- Filter by spreadsheet data sources (Google Sheets, Excel).
- Look for metrics marked with a ⚠️ warning icon.
- Open each metric and record its cell or range reference type.
To determine the reference type, review the cell or range defined in the metric settings:
| Reference format | Reference type | Preparation required | Migration approach | Example |
|---|---|---|---|---|
| A:A | Entire column range | None | Direct migration from dataset | Sheet1!A:A |
| B10:B20 | Selected column range | Add Row Number column | Filter by Row Number (X to Y) | Sheet1!B10:B20 |
| C3 | Single cell | Add Row Number column | Filter by Row Number = X | Sheet1!C3 |
| 10:10 | Row range | Transpose data (built-in option or manual transpose) | After transposing: migrate as Entire column or Selected range | Sheet1!10:10 |
| Sheet1!A:A + Sheet2!B:B | Cross-sheet reference | Create multiple datasets (or a combined tab) | Merge datasets or consolidate into one tab | Sheet1!A:A + Sheet2!B:B |
If you identify one or more metrics that use references other than entire column ranges, you can restructure your spreadsheet before migrating. This may be simpler than recreating the logic using dataset modifications.
To standardize your data, add a helper column that generates row numbers.
It is recommended to add this as the first column in your sheet to keep the structure consistent.
Insert a new column as Column A.
In the first row, enter the header
Row Number.In the second row, add one of the following:
Option 1: Copy-down formula
- Enter:
=ROW(A1). - Copy the formula down for all rows that contain data.
Option 2: ARRAYFORMULA (recommended for Google Sheets)
- Enter:
=ARRAYFORMULA(IF(B2:B<>"", ROW(B2:B)-1, "")). - This automatically generates row numbers for all populated rows without manually copying the formula.
- Enter:
To transpose your data before creating the dataset, you can either use a formula for a dynamic conversion or perform a one-time manual transpose.
If you want the transposed data to update automatically:
- Create a new tab in your spreadsheet (for example,
Transposed_Data). - In cell A1 of the new tab, enter:
=TRANSPOSE(Sheet1!A:Z).
If you prefer a one-time conversion without formulas:
- Select your row-based data.
- Copy the selection (Cmd+C / Ctrl+C).
- Go to the destination cell.
- Right-click > Paste Special > Transpose.
If your legacy metrics reference multiple tabs, you can combine the required data into a single tab before creating your Dataset.
- Create a new tab in your spreadsheet (for example,
Combined_Data). - Use formulas to pull data from other tabs.
If the tabs share the same structure and should be stacked vertically:
={Sheet1!A:B; Sheet2!A:B}This appends the rows from both tabs into one continuous table.
If you need to reference specific columns:
=Sheet1!A:A
=Sheet2!B:B
Ensure the combined tab has consistent column headers and a uniform structure across all appended data. Consolidation works best when the original tabs share the same column layout or represent different time periods or categories.
Each tab used to create a legacy metric must be recreated as a separate dataset.
In other words, one sheet equals one Dataset. If your metrics pull data from three different tabs, you will need to create three separate Datasets.
- Go to Data Manager > Datasets.
- Click + New dataset
- Select your spreadsheet data source and click Continue.
- Choose the sheet that contains your data.
- Enable the Switch rows to columns option if your metric is based on a row range and requires transposed data (optional).
- Configure the Header row setting:
- If row 1 contains column names, select 1 (default).
- If your sheet does not contain headers, select 0 (A,B,C...).
- Click Preview datato confirm the structure and formatting look correct and the data appears as expected.
- Click Continue.
- Select update frequency and click Finish.
For each legacy metric:
- Open the dataset view.
- Click + Create new metric on the right-hand panel.
- Select the appropriate measure, date,and dimension columns.
- Add filters to control which rows are included in the calculation (optional).
- Click Preview data and compare the new metric with the legacy metric to ensure the numbers align.
- Click Save.
- Replace the old metric wherever it's used across your content to ensure everything continues working with the new dataset-based metric.
Your legacy metrics pull data from an entire column, such as:
- Date column:
Sheet1!A:A - Value column:
Sheet1!B:B - Dimension column:
Sheet1!C:C
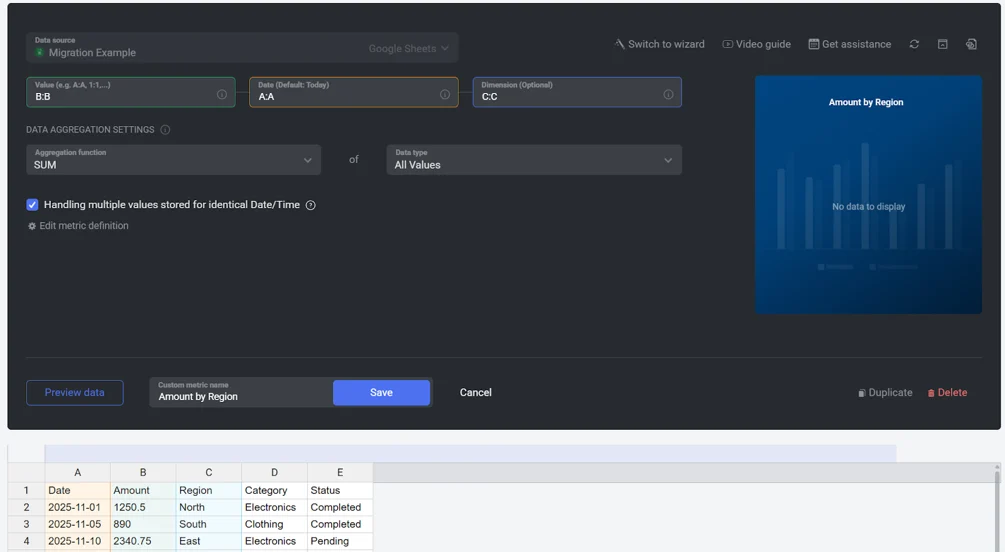
To migrate these metrics, select the same columns by name (or column letter) andchoose the equivalent aggregation function in the metric builder to match the legacy setup.
Your legacy metrics pull data from a specific row range within a column, for example: Sheet1!B10:B20.
Datasets operate on entire columns rather than fixed row ranges. To replicate a selected row range, use a Row Number column as a filterable dimension.
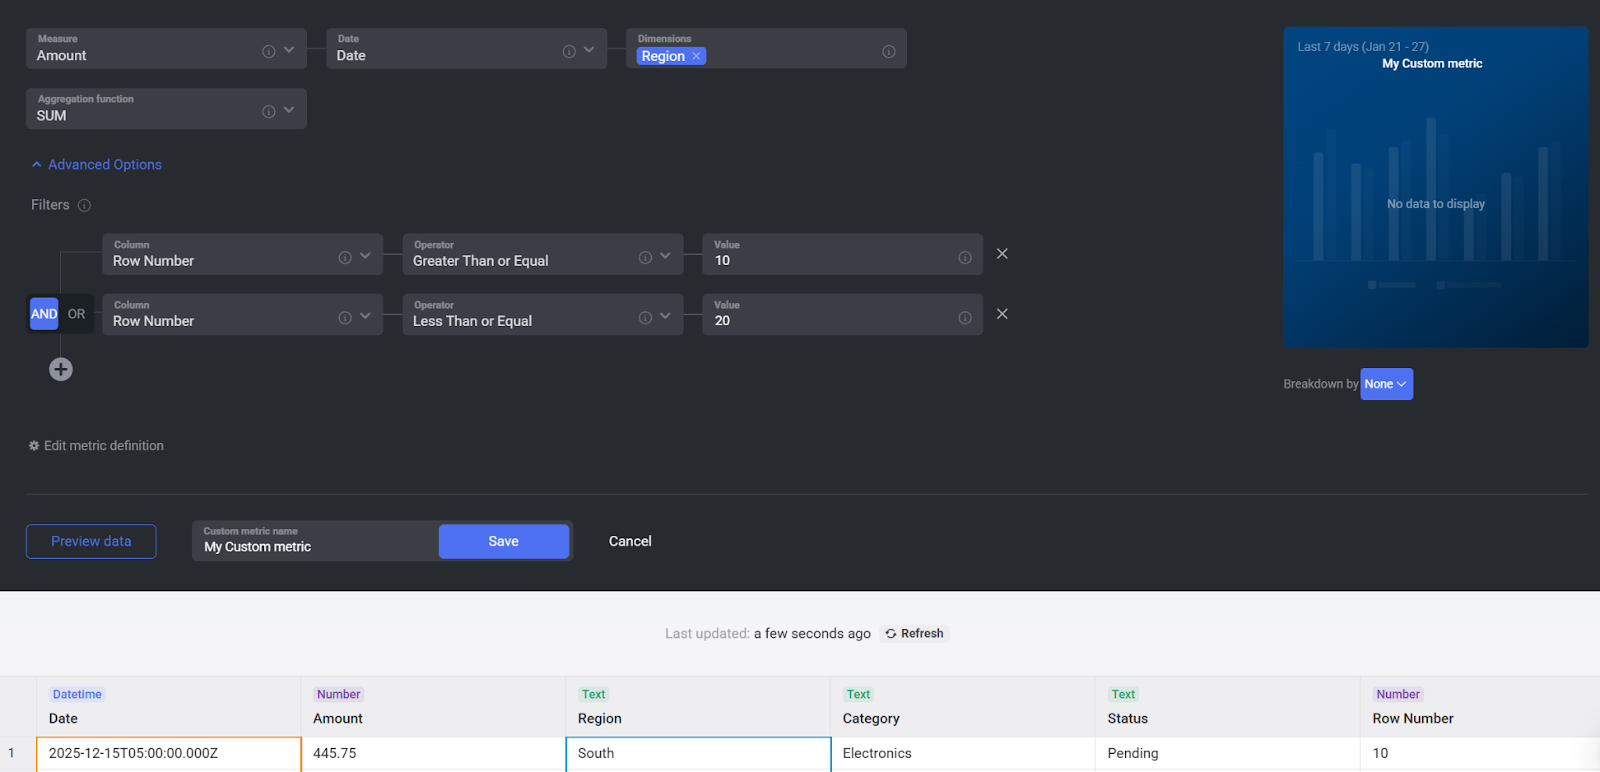
To migrate these metrics:
Select the same value, date, and dimension column(s) in the metric builder.
Choose the equivalent aggregation function that matches the legacy metric setup.
Add a filter group with the following conditions:
- Column: Row Number
Operator: Greater Than or Equal
Value: X
AND
- Column: Row Number
Operator: Less Than or Equal
Value: Y
- Column: Row Number
Replace X and Y with the starting and ending row numbers from your original range.
Your legacy metrics pull data from a single cell, for example: Sheet1!B3.
Datasets operate on entire columns rather than individual cells. To replicate a single-cell reference, use a Row Number column as a filterable dimension to isolate that specific row.
To migrate these metrics:
- Select the same value, date, and dimension column(s) in the metric builder.
- Choose the equivalent aggregation function that matches the legacy metric setup.
- Add a filter group with the following condition:
- Column: Row Number
- Operator: Equals
- Value: X
Replace X with the row number from your original cell reference.
Your legacy metrics pull data from an entire row or a range of rows, for example: Sheet1!10:10.
Since datasets are column-based, row-oriented data typically needs to be transposed before building metrics.
After transposing the data:
- If all resulting rows are in use, follow the same process as described in Entire column range metrics. Select the relevant columns in the metric builder and apply the appropriate aggregation.
- If only specific rows are in use, follow the same process as described in Selected column range metrics. Use the
Row Numbercolumn as a filterable dimension to isolate the required rows.
Your legacy metrics pull data from multiple sheets within the same spreadsheet, for example: Sheet1!A:A + Sheet2!B:B.
Datasets are created per sheet, meaning each tab must be configured as a separate dataset. Cross-sheet references cannot be recreated within a single dataset.
To migrate these metrics, use one of the following approaches.
Merge multiple datasets (recommended)
Consolidate data into one tab
- Create a new tab that references the required sheets using formulas (see Step 2).
- Create your dataset from the combined tab.
Use Data Calculations
- Create separate datasets and metrics.
- Use Data Calculations to combine the metrics (for example, Revenue − Costs).
Choose the approach that best matches how your data is structured.
FAQ
Do I have to migrate everything at once?
No. You can migrate metrics at your own pace before the deprecation takes effect.
Group related metrics and migrate them together as a consolidated dataset. This makes it easier to validate results and ensure everything works correctly before moving on to the next group.
My date column isn't being recognized
If your date column is not detected during dataset creation, it is usually due to formatting issues in the spreadsheet.
Check that:
- All values in the column are valid dates
- The column uses a consistent date format
- There are no mixed text or non-date values
If automatic detection fails, manually select the date column during dataset configuration.
For detailed guidance on preparing your spreadsheet, see this guide.
My metric values look different after migration
If your new dataset-based metric does not match the legacy metric, review the following:
- Aggregation method changed — Confirm the metric uses the same aggregation (Sum, Average, Count, etc.).
- Different date range — Make sure you are comparing the same time period**.**
- Header row misconfigured — Verify that the correct row is set as the header in the Dataset.
- Missing row filter — If the legacy metric referenced a range (for example,
B10:B20), ensure the correspondingRow Numberfilter has been added.


