


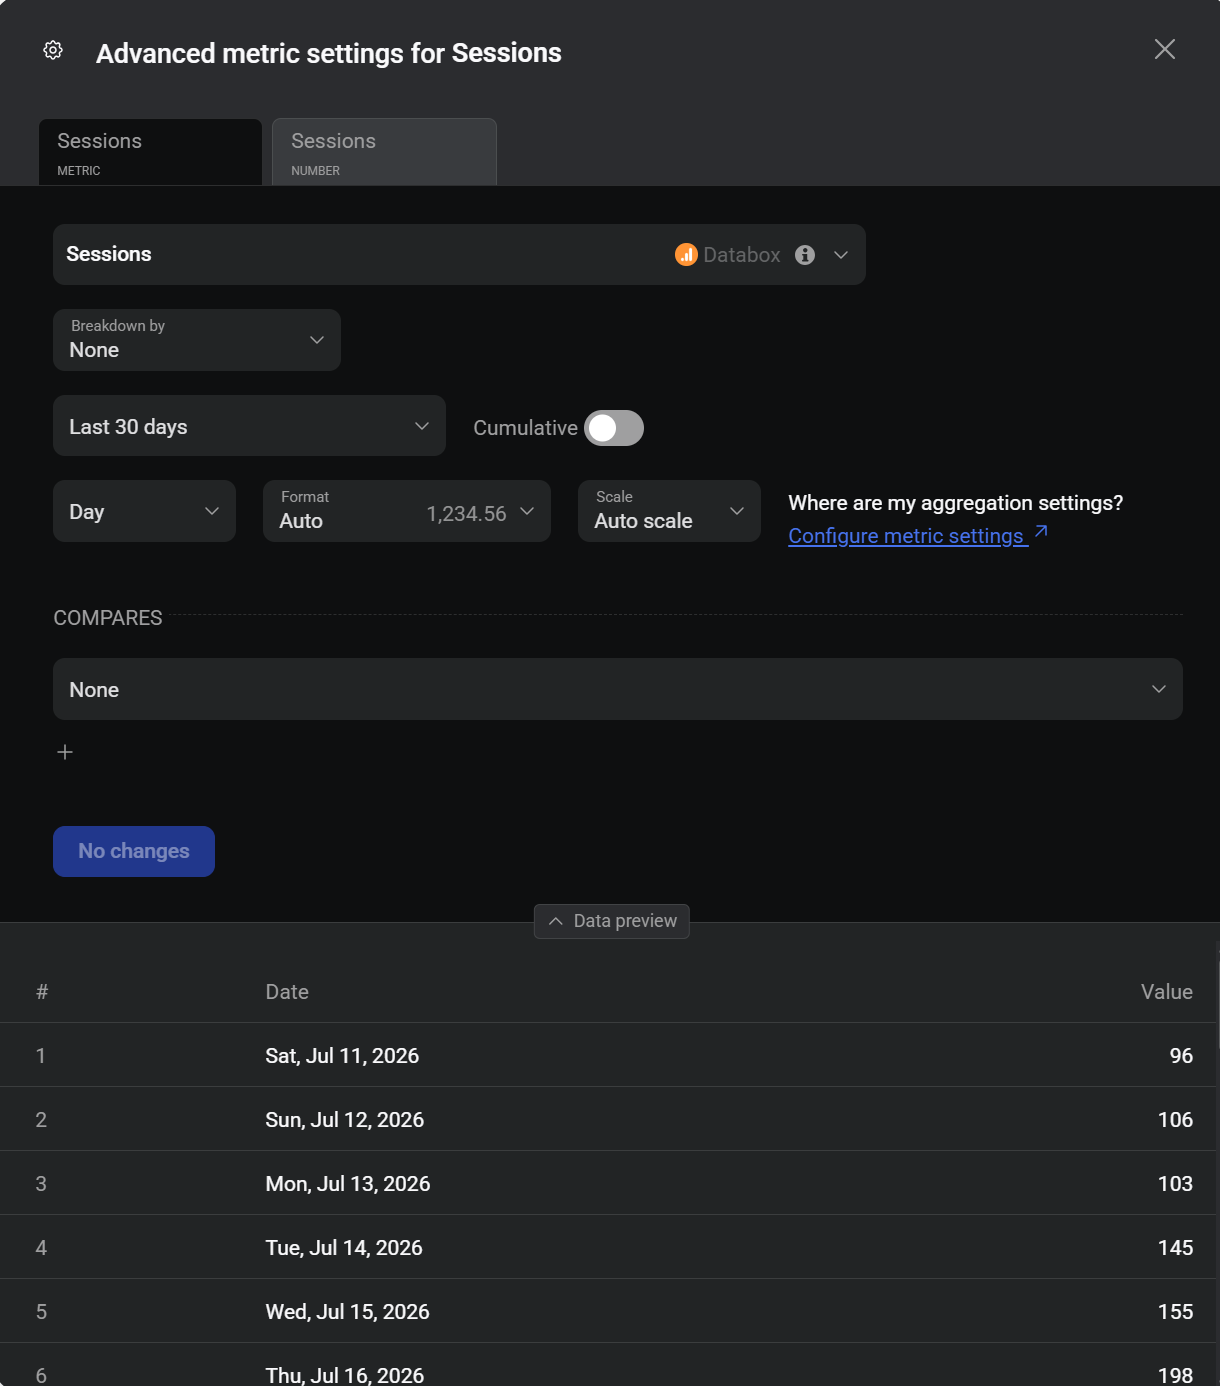
Some visualizations plot more than one element from a single metric — a Line chart, for example, can show the metric's line, a comparison line, and a summary number all at once. Each of those elements can need its own granularity, format, or scale, but the Datablock Editor only lets you configure the metric as a whole. Advanced metric settings opens a dedicated window scoped to one specific line, number, or row, where you can adjust its settings individually, decide whether changes should carry over to the other elements automatically, and preview the resulting data before saving.
- Open the dashboard in the Designer and click the Datablock you want to edit. The Datablock Editor opens on the right.
- Under the metric you want to adjust, click Advanced metric settings.
Advanced metric settings are also available for metrics used inside a custom metric formula. Open the custom metric, click the metric operand you want to adjust within the equation, then click  Advanced Settings in the top right of the selection window.

Visualizations that plot more than one element from a metric show a tab for each one — for example, a Line chart shows a tab for the line, one for the comparison line if a comparison is set, and one for the number displayed above the chart. Select a tab to configure that specific element.
Renaming a line, column header, or similar label is done from the Metric name field in the Datablock Editor, not from a tab in this window — see Configure a Datablock.
By default, Auto-Update is enabled, so changes made on the first tab apply to every other tab automatically. Turn it off to configure each tab independently — for example, to give the comparison line a different format than the main line.
| Field | Description |
|---|---|
| Data source, Metric, Date range, Cumulative | Mirror the same fields in the Datablock Editor. It's recommended to set these in the Datablock Editor rather than here. |
| Breakdown by, Filters | Segment or narrow down the data included in this element. See Filter your data. |
| Graph by (granularity) | Sets the data points plotted for this tab, independent of the Datablock's overall granularity. Options depend on the data available for the selected metric. |
| Format, Scale | Controls the unit, decimal, and rounding display for this tab's values. See Change number format and scale. |
| Compares | Sets what this tab's value is measured against, and how the change is calculated and formatted. See Change comparison settings. |
| Retain metric settings for all date ranges | Available only for a metric used inside a custom metric formula. Enable it to lock the operand to the date range set here, so its value stays fixed no matter what date range is applied where the metric is visualized, instead of shifting with the viewer's date range selection. |
Expand Data preview at the bottom of the window to see the underlying dates, metric values, and — if a comparison is set — the comparison and change values behind the current tab. It updates live as you adjust settings, so you can verify a selection before applying it.
FAQ
Do I need to configure every tab separately?
No. With Auto-Update enabled, configuring the first tab applies those settings to the rest. Turn Auto-Update off only when a tab — like a comparison line — needs its own format, scale, or granularity.


