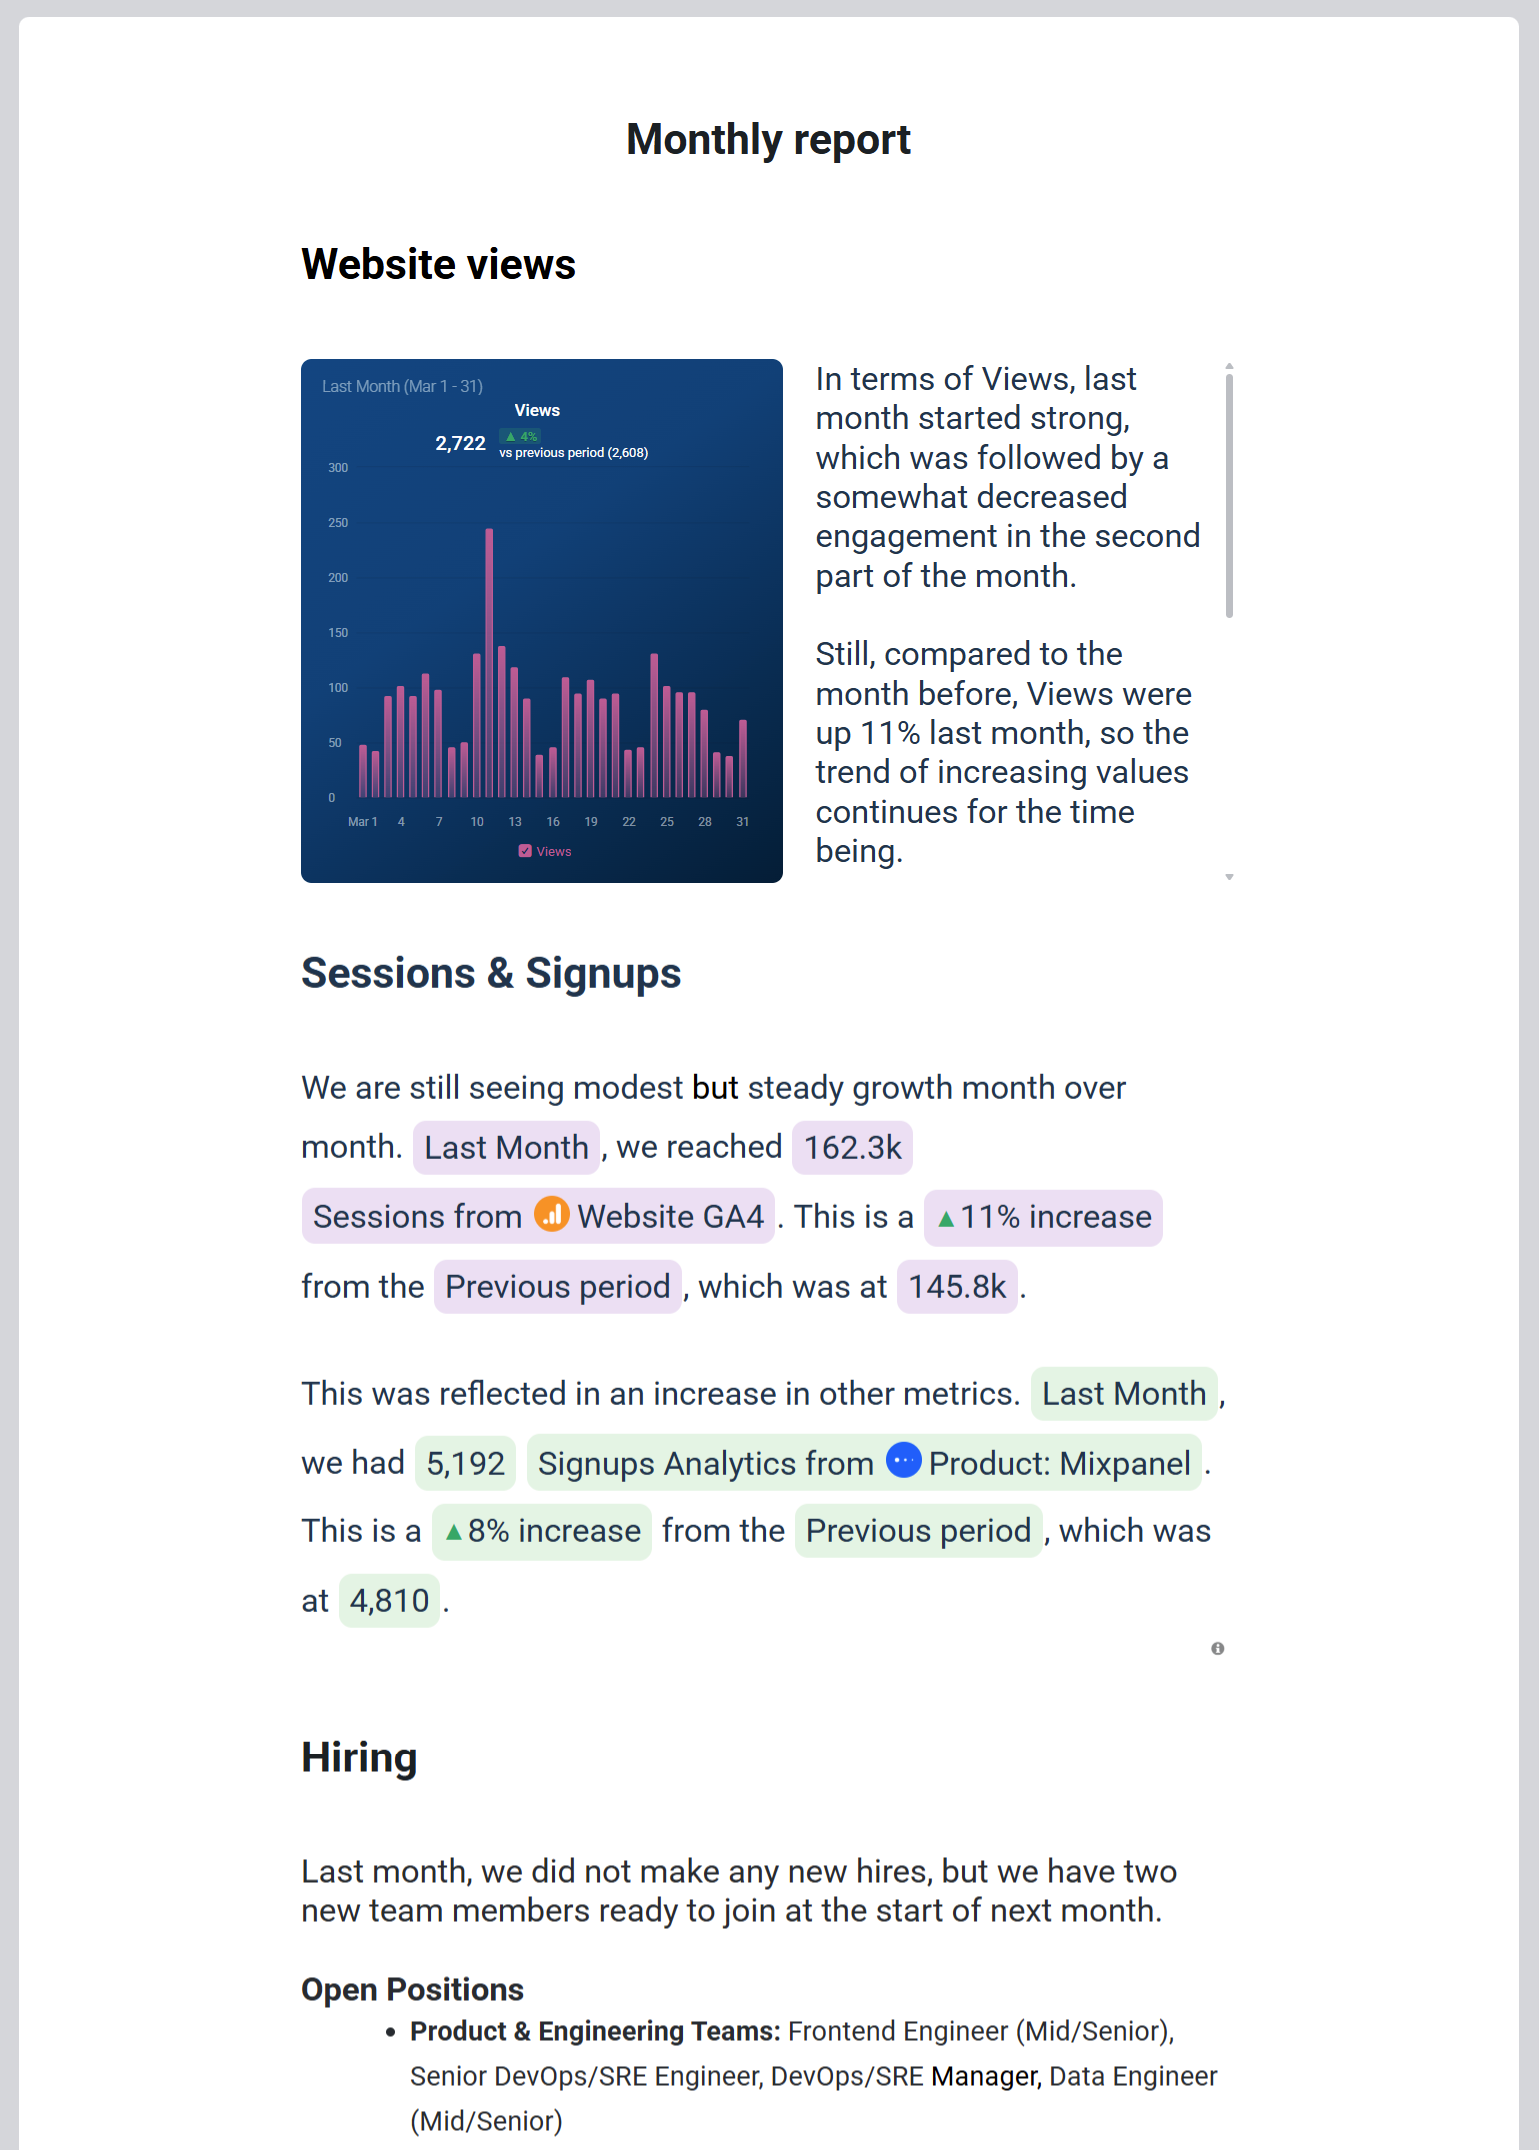
A single-page report offers a flexible, scrollable format for presenting detailed data and insights that stakeholders can review at their convenience. It enables clear content organization, including performance summaries, data comparisons, and recommendations, through structured text, charts, and visualizations. This format is ideal for delivering comprehensive analysis without the need for time-sensitive meetings.
You can create a presentation in the following ways:
- On the Reports page, click + New Report.
- On the Looped Databoards page, click the down arrow (
 ) and select Create a Report.
 - On the Databoards page, hover over a Databoard, click More, select Add to Report, and then click + Create new Report in the selector.
Once in the report editor, select Page.
Hover over the top of the presentation to find the Add emoji and Add cover links.
Click on Add emoji to add an emoji to the report. Emojis can be used in all header and text elements for added visual appeal.
Click on Add cover to insert a cover image at the top of the presentation.
- The cover photo area is fixed, and any image you upload will be resized to fit the space.
- Use the crop option to adjust the image's positioning as needed, ensuring it aligns with your preferred view.
In a single-page report, content is organized by adding individual elements, such as text, images, or data visualizations. Once added, these elements are organized into rows of 1-3 columns, with each element placed within these columns.
To add new elements to your presentation:
- Move your cursor over the page or slide until plus (+) signs appear at anchor points.
- Click the plus (+) sign where you'd like to add the new element.
- A dropdown menu will appear. Select the reporting element you want to add.
For more information on supported content elements, refer to this article.
FAQ
Is it possible to change the background color or add a background image to a single-page report?
No, single-page reports do not offer background customization options at this time.
What happens to slide titles, notes and background settings if I switch from slide presentation to a single-page report?
Slide titles, notes, and background settings are retained but will remain hidden in a single-page report. When switching back to the slide presentation format, they will be restored, though their alignment with the slide content might vary.
Who can view a single-page report?
Only users with access to all the Databoards included in the report can view it. If they do not have access to any of the Databoards, the report will not be visible on their Reports page.


