


Reporting stalls when every question means another spreadsheet export. A dashboard puts the metrics your team actually watches on one live screen, refreshed automatically from your connected data sources. Databox gives you four ways to get there — start from nothing, let the wizard assemble it, pick a template, or describe what you need and let AI build it — so you can match the effort to how clear you already are about what you want to see.
Each starting point lands you in the same place: a dashboard you can edit in the Designer. The difference is how much is filled in for you.
| Starting point | Best when |
|---|---|
| Start blank | You know exactly which metrics and visualizations you want, and you want full control over the layout. |
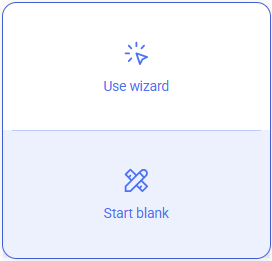
| Use wizard | You know the data source and the metrics, but you'd rather not place every datablock yourself. |
| Use account template or Use public template | Someone has already built this report — for another client, or for a common use case like paid ads or SEO. |
| Create with AI | You know the topic you want to report on, but not yet which metrics belong on the dashboard. |
- Go to Dashboards.
- Click + New dashboard.
- The empty dashboard opens in the Designer, where you can add metrics and visualizations.
You can also scroll to the end of the dashboard grid and click the + New dashboard tile, then choose Start blank.
See Edit a dashboard for how to add and arrange datablocks once you're in the Designer.
The wizard walks you through picking a data source, choosing metrics, and connecting the data, then assembles the dashboard for you.
- Go to Dashboards.
- Click the drop-down arrow (
 ) next to + New dashboard and select Use wizard.
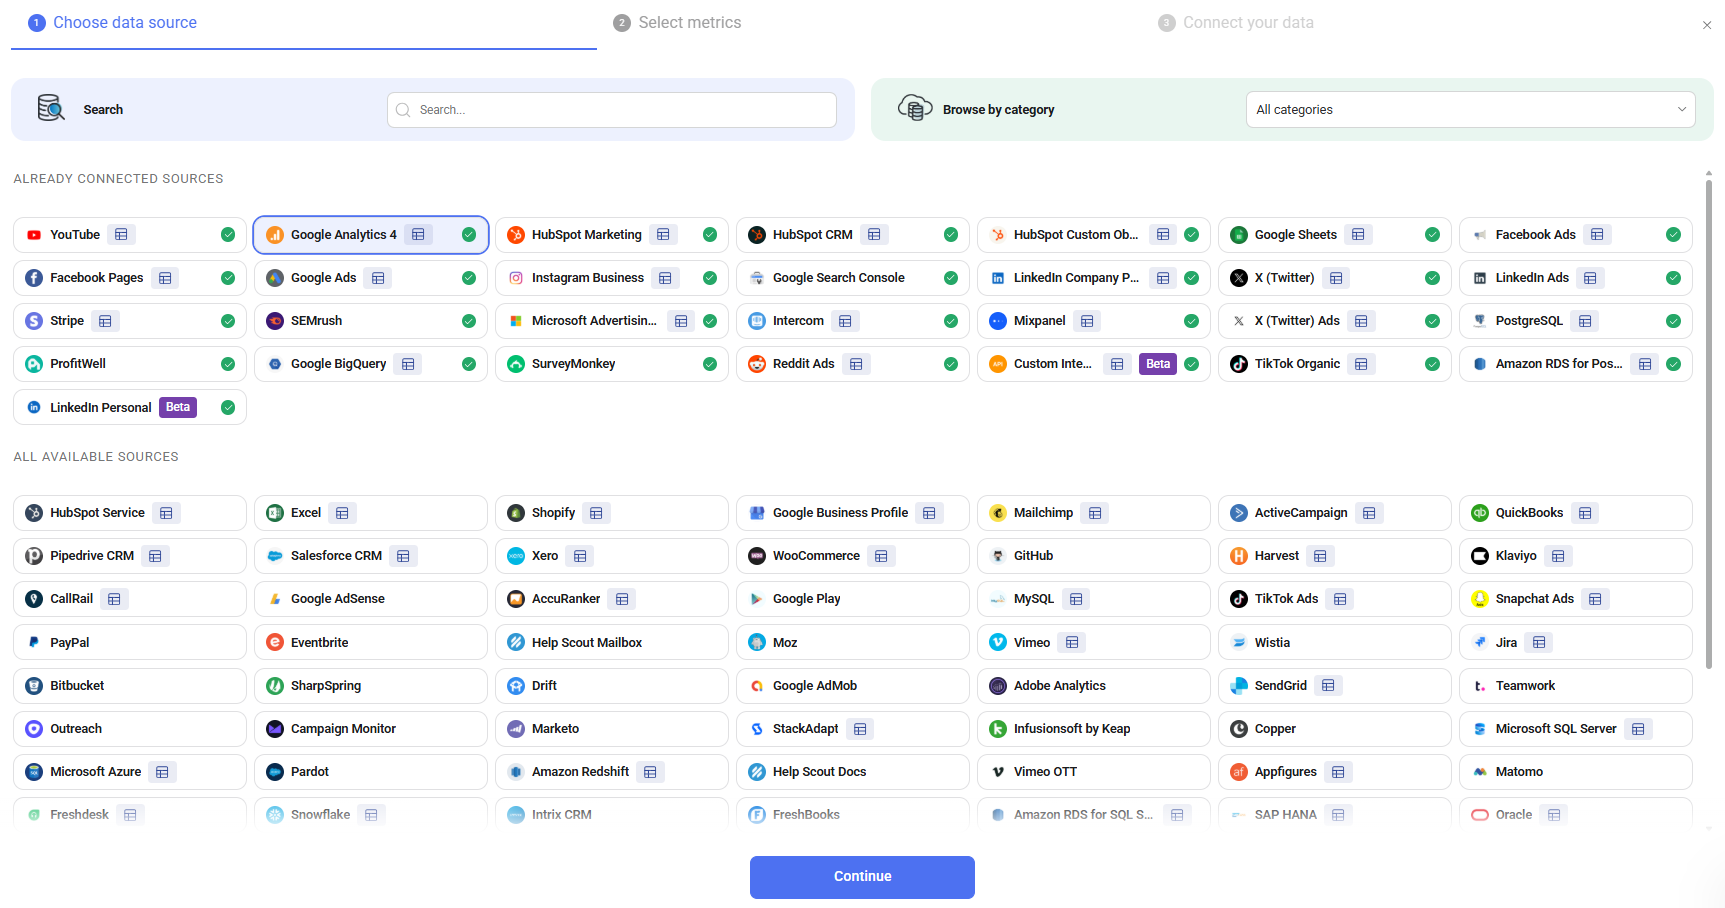
 - On Choose data source, select the source you want to report on. Sources you've already connected appear under Already connected sources; everything else is under All available sources. Use Search or Browse by category to narrow the list.
- Click Continue.
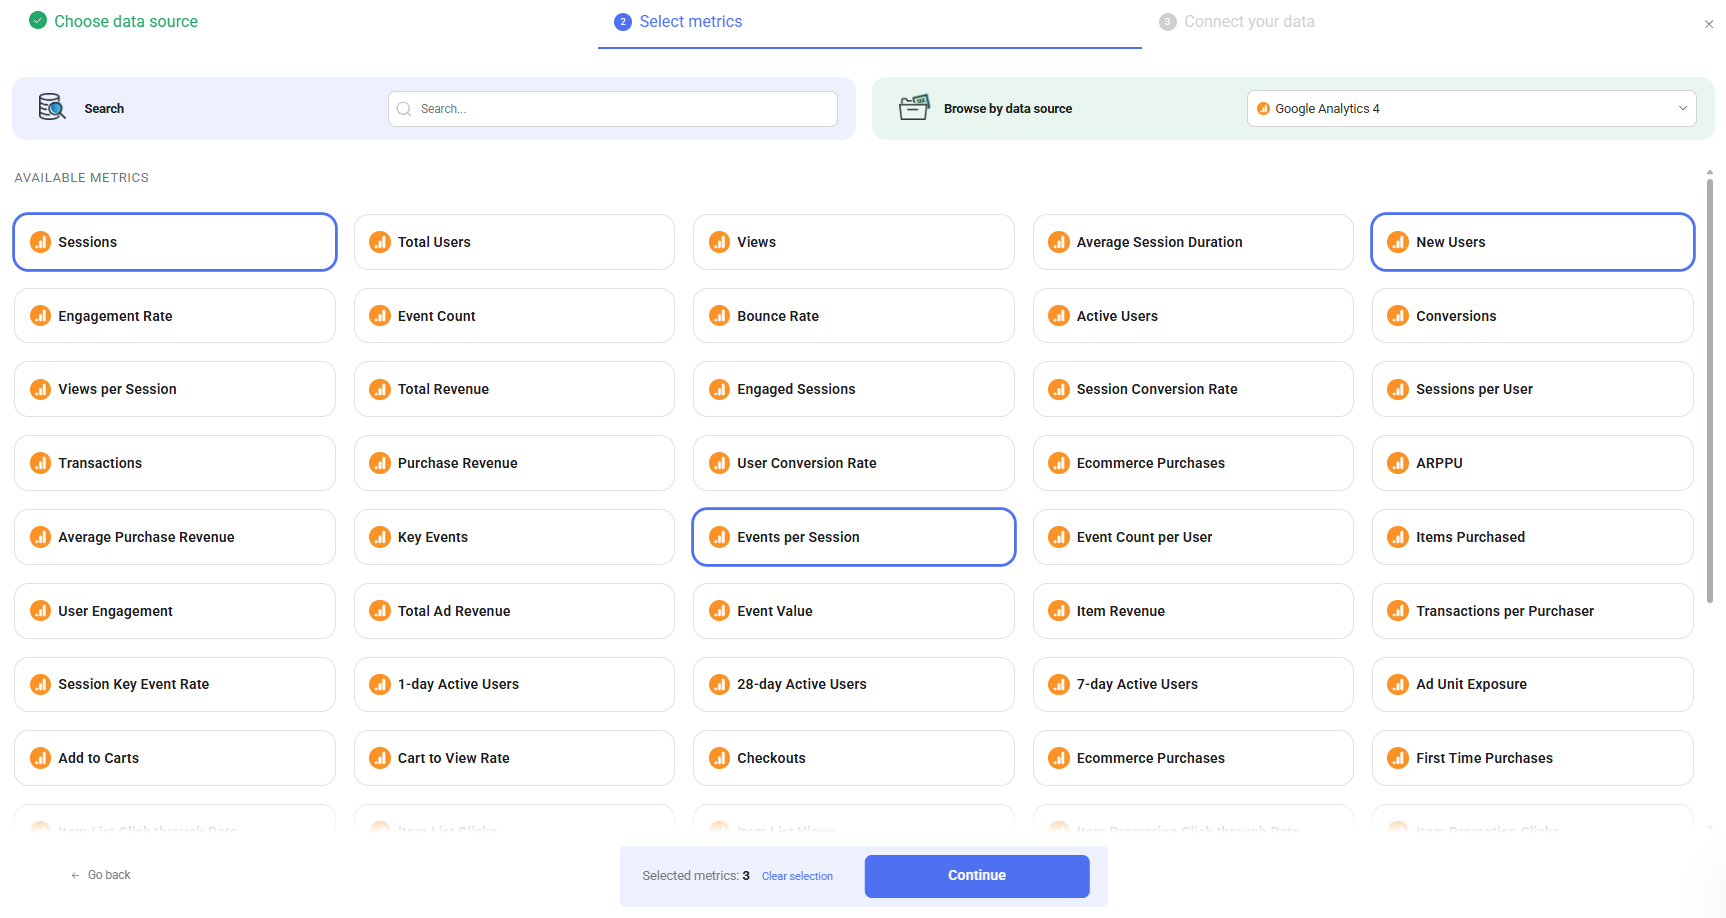
- On Select metrics, click each metric you want on the dashboard. The running count appears at the bottom as Selected metrics, and Clear selection starts over.
- Click Continue.
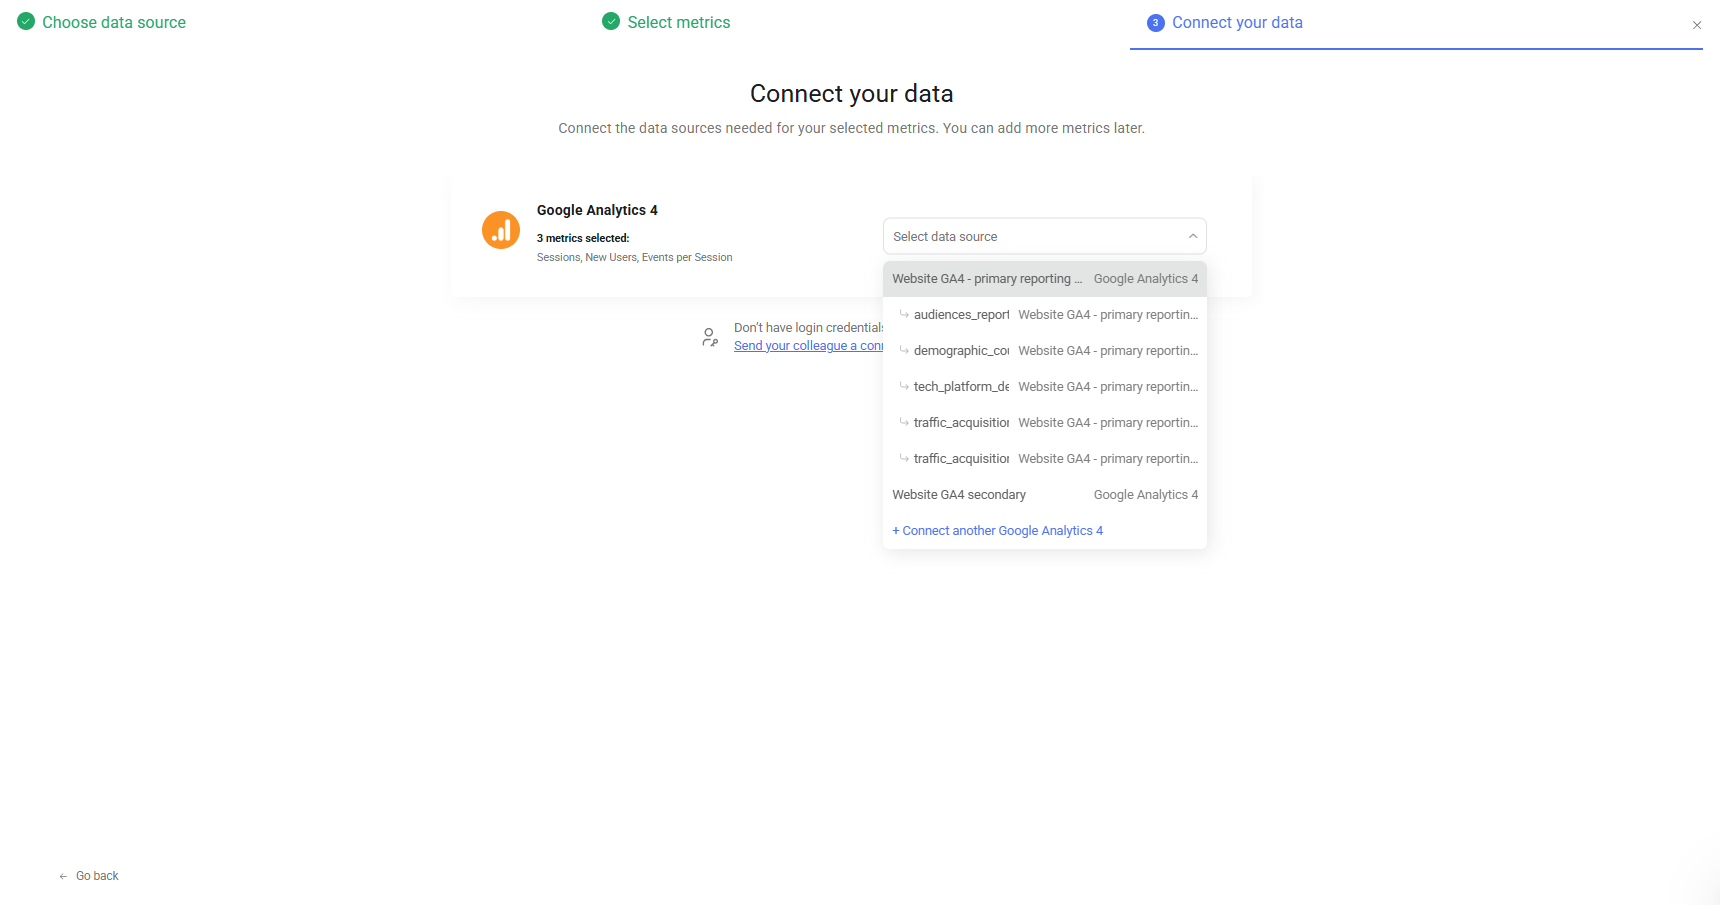
- On Connect your data, use the Select data source drop-down to pick which connected account should feed the dashboard. To authorize a new one, select + Connect another at the bottom of the list.
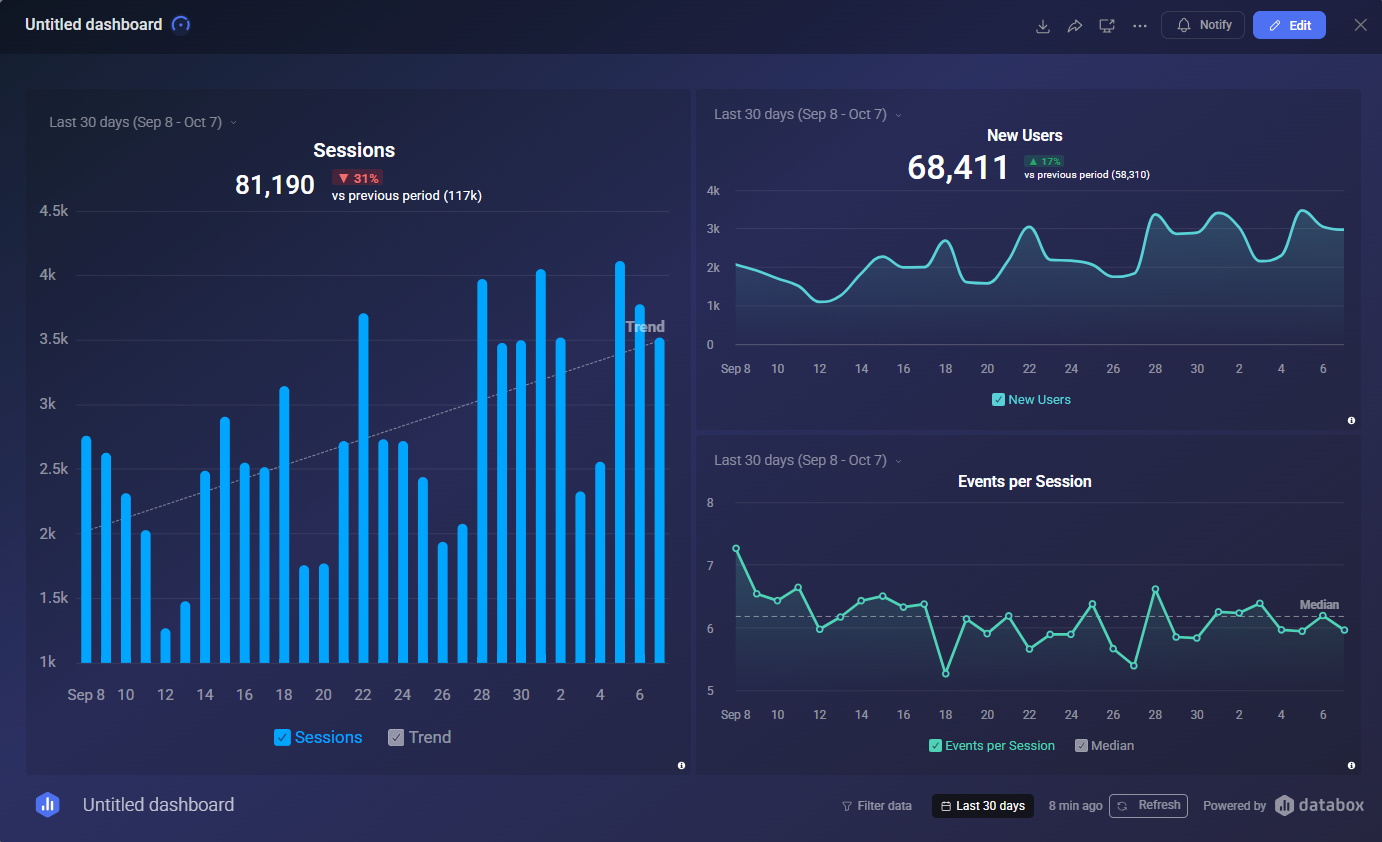
The finished dashboard opens as Untitled dashboard with a datablock for each metric you selected.

When you know the subject but not the specific metrics, let AI propose the dashboard.
- Go to Dashboards.
- Click Create with AI.
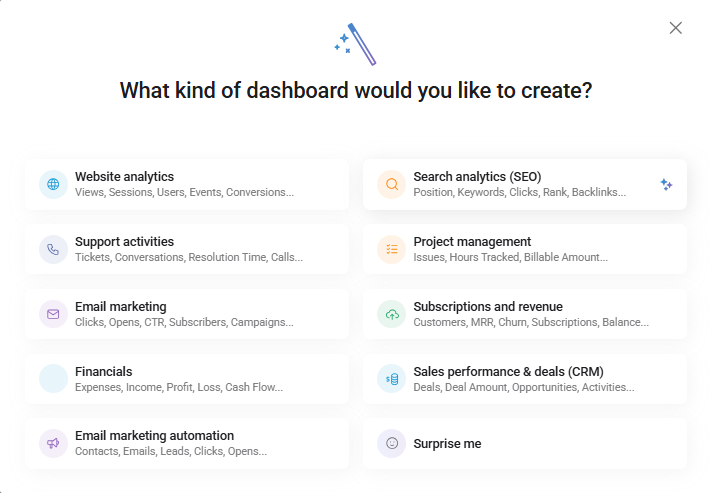
- Choose the kind of dashboard you want — for example Website analytics, Subscriptions and revenue, or Sales performance & deals (CRM). Pick Surprise me to let Databox choose based on your connected data.
Treat the result as a starting point: open it in the Designer and swap, remove, or add metrics until it reflects how your team measures the topic.

Templates let you reuse a dashboard that already works. Account Templates are the ones your organization has saved; public templates are prebuilt by Databox and partners.
- Go to Dashboards.
- Click the drop-down arrow () next to + New dashboard.
- Select Use account template or Use public template.
- Pick a template and connect the data sources it asks for.
You can also browse these from the Account Templates and Public Templates tabs at the top of the Dashboards page. See Use a template for the full flow, and Create a template to save one of your own.
Duplicating is the fastest way to report on the same structure for a different client, data source, or time period — and a safe way to keep a copy before you make significant changes.
- Go to Dashboards.
- Hover over the dashboard and click the three dots (
 ).
). - Select Duplicate.
The copy appears on the Dashboards page. Open it in the Designer to repoint its Datablocks at a different data source — for example, duplicating a Google Ads performance dashboard and switching each datablock to Facebook Ads.
Name dashboards after the theme of the data on them — "Traffic Overview" or "Sales Performance" — so the list stays scannable as it grows.
- Go to Dashboards.
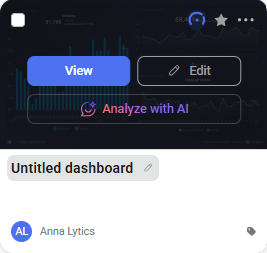
- Click the dashboard's current name.
- Type the new name and press Enter.
In the Designer, click the dashboard name at the bottom of the dashboard itself, and edit the text directly.
FAQ
Can I add metrics from more than one data source to the same dashboard?
Yes. The wizard starts you with a single source, but once you're in the Designer you can set a different data source on each Datablock, and even combine sources on one Datablock. See Edit a dashboard.
Do I need to save a new dashboard?
No. Changes in the Designer save automatically. The toolbar shows Saving while a change is being stored and Saved once it's done.
Does duplicating a dashboard also duplicate its notifications and schedules?
No. Notifications, scheduled snapshots, and share links belong to the original dashboard. Set these up again on the copy if you need them.
Who can see a dashboard I create?
That depends on how it's shared and where it belongs to. A new dashboard isn't shared outside your organization until you create a share link for it — see Share a dashboard.


