
While viewing a Databoard is often enough to monitor performance at a glance, a quick overview may not always provide the full picture. When something looks off or requires further investigation, decision-makers and analysts often need to dive deeper into the underlying data to understand what's driving a change, compare different segments, or identify potential issues and opportunities.
The expanded Datablock view makes this possible without switching pages or creating a separate report. By clicking on a Datablock, you can open it in a larger format and interact with the data more meaningfully. Apply filters, change the visualization, adjust the date range, and examine your data in more detail. If the changes help communicate your insight more clearly, you can save them to update the Datablock on your Databoard.
While previewing a Databoard, click the  icon in the top-right corner of a Datablock to open it in a full-screen overlay. This expanded view gives you more space to explore the data, making it easier to focus, interact with, and adjust what's displayed.
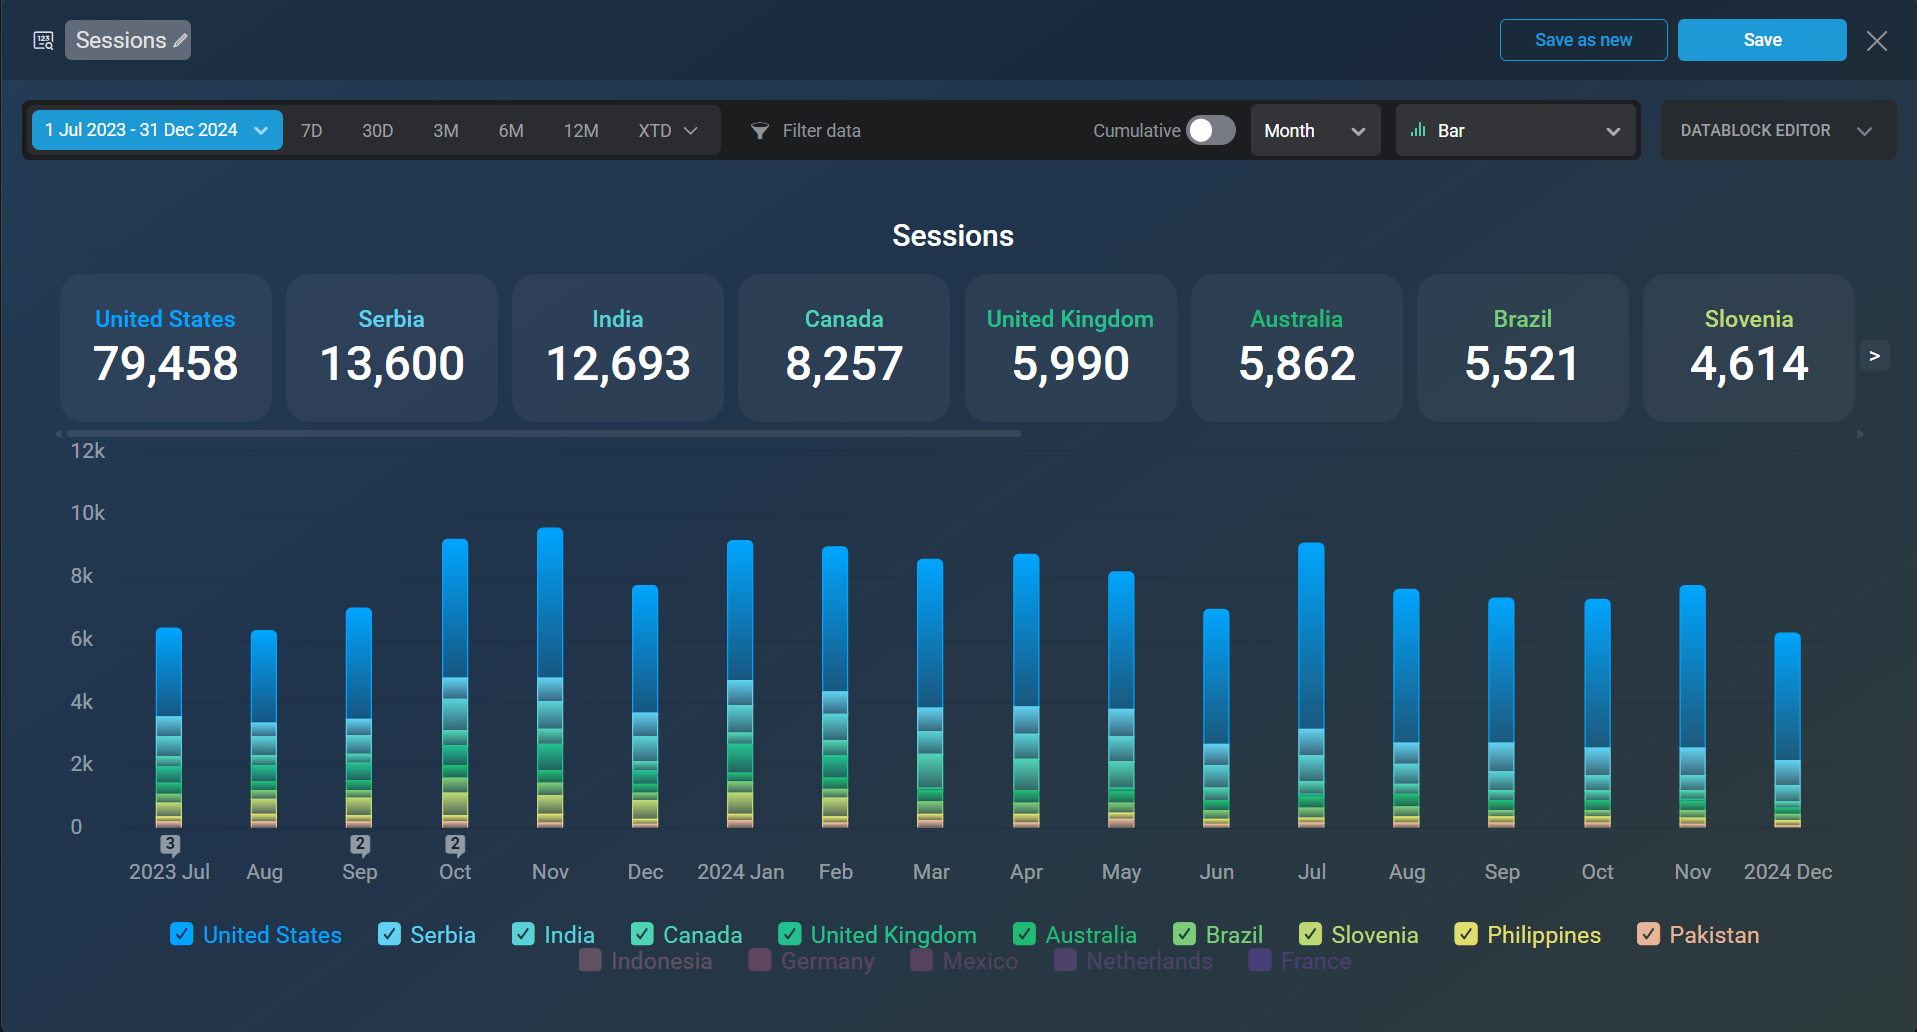
In the expanded view, you can explore and modify the Datablock to better understand your data or tailor how it's displayed. Available options include:
- Changing the visualization type
- Adjusting the date range
- Applying filters (e.g., by user, region, campaign, etc.)
- Editing Datablock settings (such as metrics, visualization settings, and more)
These controls allow you to experiment with different views and uncover insights that might be hidden in the default Databoard layout.
If you make changes that improve clarity or better fit your workflow, you have two options to save them:
- Save as new — create a new Datablock on the same Databoard using the selected settings.
- Save — update the original Datablock with the applied changes.
To use either option, you must have edit permissions for the Databoard. If you don't, you can still explore and adjust the view, but you won't be able to save any changes.
If no save action is taken, the Datablock will remain unchanged, allowing you to explore freely without committing to any modifications.
FAQ
Can I expand any Datablock?
Can I undo changes after saving?
There is no "undo" option after saving, but you can manually revert your settings by re-opening the expanded view and adjusting the filters, visualization type, or date range again.
Will my filters and changes affect the rest of the Databoard?
No. Any changes made in the expanded view apply only to the Datablock you're editing.
Will the saved changes affect everyone who views the Databoard?
Yes. When you save changes to a Datablock, those updates will be visible to anyone who has access to the Databoard.


