
Availability
Mixpanel is a product analytics platform that helps businesses understand how users interact with their digital products. It tracks events, user journeys, funnel conversions, and retention patterns across web and mobile applications, enabling product and growth teams to make data-driven decisions. Connecting Mixpanel to Databox brings your product analytics alongside data from other tools, so you can monitor user engagement, measure feature adoption, and track conversion performance in a unified view.
If your credentials don't include full access to the data source, make sure your access level meets any permission requirements listed in the Specification section of the integration's page in the Metric Library.
Mixpanel supports two authentication methods when connecting to Databox: Service Account authentication and Project Secret authentication. Service Account is the recommended method.
Use this method for all new connections. Service Accounts are the authentication mechanism recommended by Mixpanel going forward and are required when using Mixpanel's Group Analytics.
- In Mixpanel, go to Settings > Project Settings > Service Accounts. If no service account exists, click Add Service Account to create one. Save the Username and Secret that are generated — the secret is only shown once.
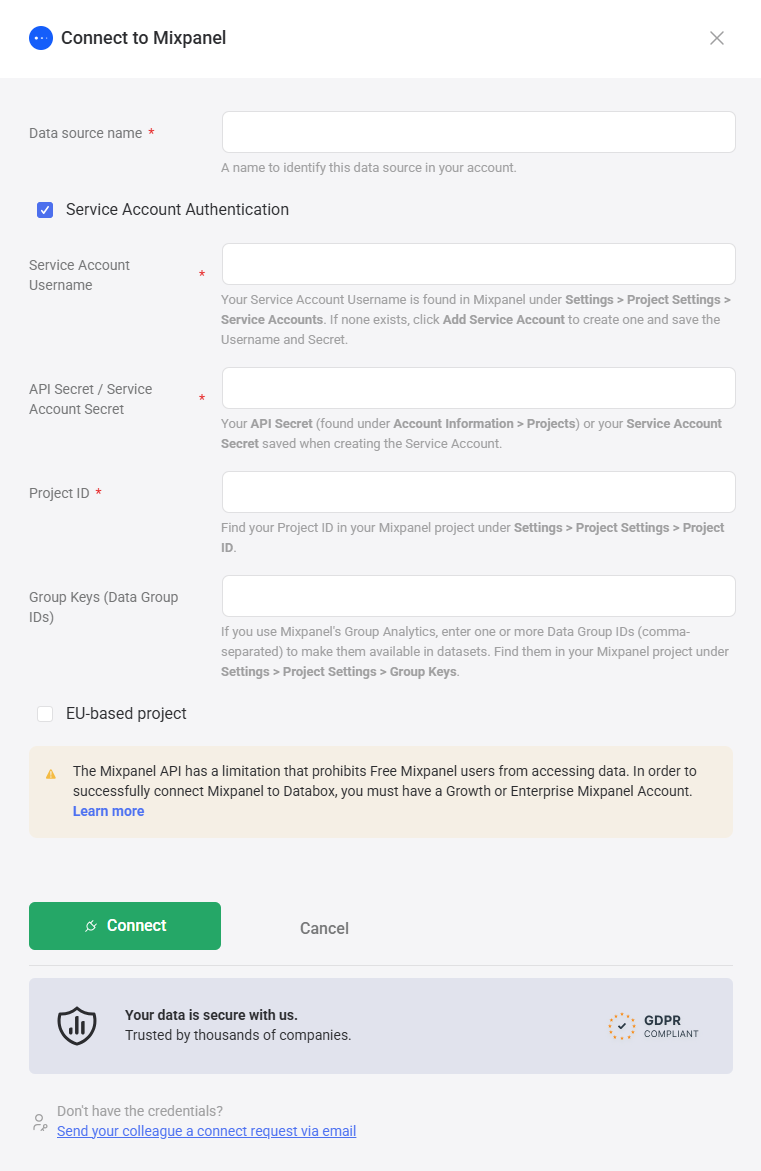
- In Databox, enter a name for the connection in the Data source name field.
- Check the Service Account Authentication checkbox.
- Enter the service account username in the Service Account Username field.
- Enter the service account secret in the API Secret / Service Account Secret field.
- Find your Project ID in Mixpanel under Settings > Project Settings > Project ID and enter it in the Project ID field.
- If you use Mixpanel's Group Analytics, enter one or more Data Group IDs (comma-separated) in the Group Keys (Data Group IDs) field. Find these in Mixpanel under Settings > Project Settings > Group Keys. This makes Group Analytics data available in datasets.
- Click Connect.
The API Secret / Service Account Secret field in Databox accepts Mixpanel's Project Secret when Service Account Authentication is unchecked. Use this only if you have an existing connection that relies on it.
- In Mixpanel, go to Account Information > Projects and locate your Project Secret.
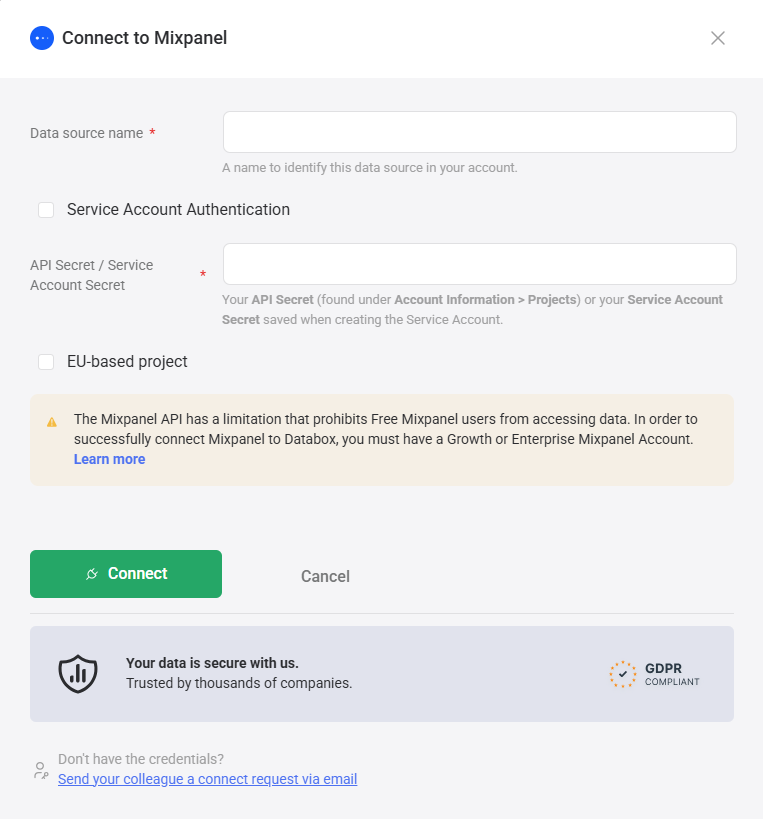
- In Databox, enter a name for the connection in the Data source name field.
- Leave the Service Account Authentication checkbox unchecked.
- Paste your Project Secret into the API Secret / Service Account Secret field.
- If your Mixpanel project is hosted in the EU data center, check the EU-based project checkbox.
- Click Connect.
The Mixpanel integration allows you to create custom metrics using the metric builder, ideal for visualizing data not included in the basic metrics offered by the integration.
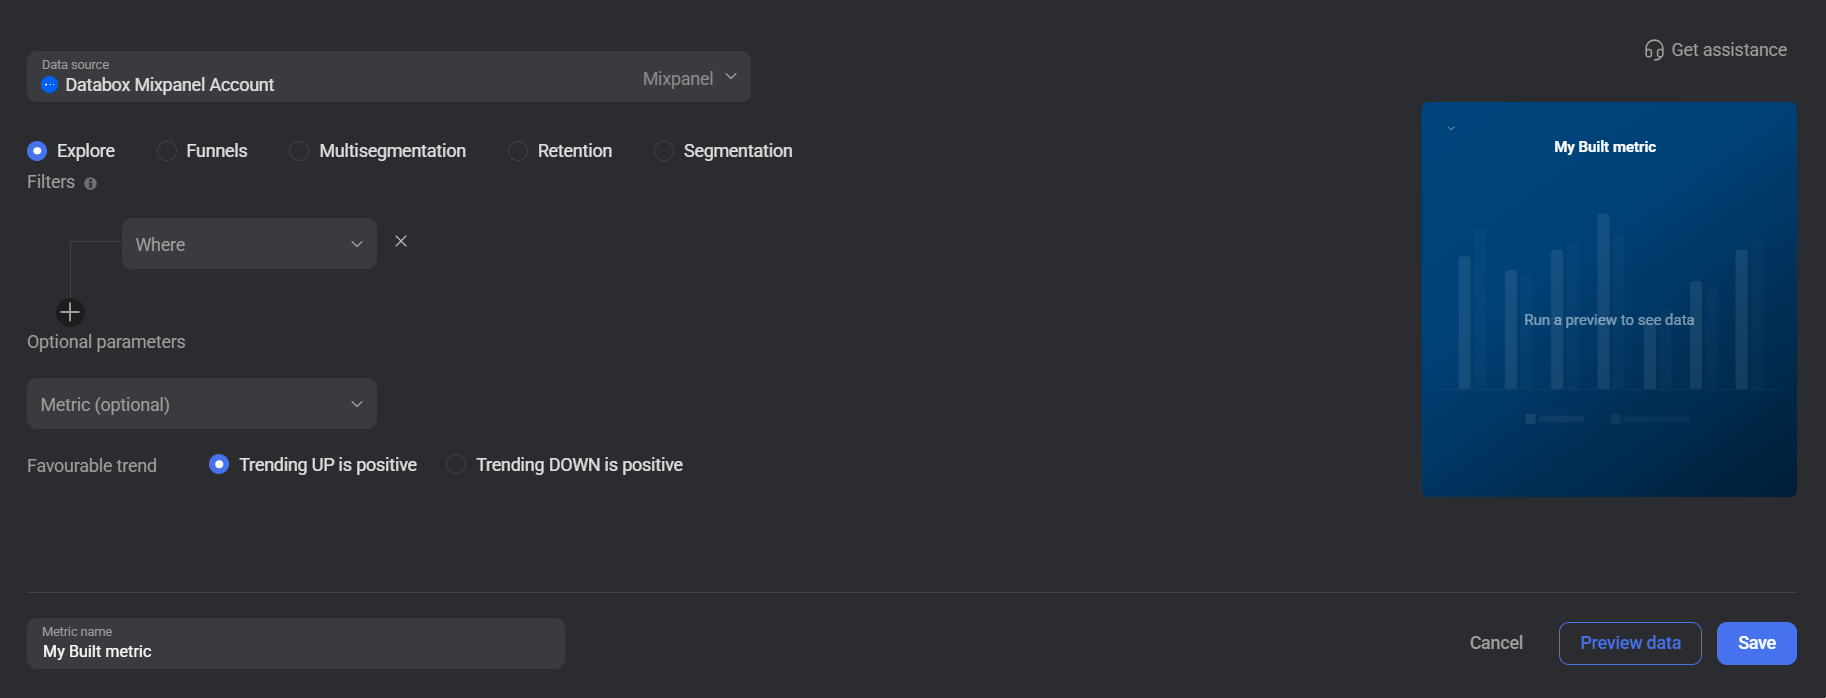
To create a custom metric, select one of the five query types — Explore, Funnels, Multisegmentation, Retention, or Segmentation — and configure the available options. Each query type exposes different selectors and filters based on the kind of analysis you want to perform.
The query types available for metric creation are listed below.
The Explore query type queries Mixpanel People (Engage) data — user profile records stored in Mixpanel. Use it to filter a user population by their properties and optionally aggregate a metric across the filtered set.
Add one or more filter conditions in the Filters section by selecting a property, its type (String, Boolean, Number, or Date), and an operator. Available operators depend on the selected type — for example, string properties support Equals, Contains, and Is set, while date properties let you filter relative to the current time. Expand Optional parameters to select a Metric, Metric operation, and Dimension.
 In Mixpanel: Go to Users to browse available people properties before building your query.
The Funnels query type measures conversion rates across a sequence of events. Use it to track how many users complete each step of a defined funnel and identify where drop-offs occur.
Select the Funnel you want to measure from the funnel selector, then choose the Funnel data type: Counts (daily), Overall conversion ratio, or Step conversion ratio.
In Mixpanel: Go to Reports > Funnels to find and review your saved funnels. The funnel name shown there is what appears in the selector.
The Multisegmentation query type lets you build composite event metrics by combining multiple aggregation operations. Use it when you need to calculate values that require both an inner aggregation (e.g., averaging a property per event) and an outer grouping (e.g., summing across a dimension).
Add one or more filter rows using the + button. Each row defines an Inner operation (e.g., AVG, SUM), an Inner dimension, an Outer operation (e.g., BY), and an Outer dimension. Use the Filters (Where) section to apply additional property-level filters to the query.
In Mixpanel: Go to Reports > Insights and apply multiple breakdowns to explore the events and dimensions available for multisegmentation queries.
The Retention query type measures how often users return to perform an event after an initial action. Use it to track user retention curves and understand long-term engagement patterns.
Select the Event you want to segment on using the event selector. Choose whether to display results as Counts or Percentages using the Push values dropdown.
In Mixpanel: Go to Reports > Retention to review your retention reports and identify the event you want to track.
The Segmentation query type lets you measure a specific event metric with optional dimension breakdown and property filtering. Use it to track totals, averages, or unique counts for any event, optionally split by a dimension.
Select the Metric (Event) and choose a Metric operation of Count or SUM. Optionally enter a Dimension and set the Dimension Type (Boolean, Date, Number, or String). Add one or more filter conditions in the Query Filters section using the Where rows and the + button. Select the aggregation Type: Average, Total, or Unique. Expand the Advanced section to optionally enable Push timestamp instead of value.
In Mixpanel: Go to Reports > Insights to explore events, their properties, and segmentation breakdowns before building your metric.

The Mixpanel integration supports datasets. When you connect using Service Account authentication and provide one or more Group Keys (Data Group IDs), Mixpanel Group Analytics data becomes available for use in datasets. Each Data Group ID corresponds to a group type defined in your Mixpanel project (e.g., Company, Account) and allows you to build datasets that aggregate data at the group level rather than the individual user level.
For comprehensive details on metrics, data availability, templates, specifications, usage guidelines, and other key information, refer to the resources listed below.


FAQ
What is the difference between Project Secret and Service Account authentication?
Project Secret authentication uses a project-level credential, while Service Account authentication is the recommended method going forward — it supports broader project access and is required when using Mixpanel Group Analytics data in datasets.


