
Availability
Stripe is a widely used payment processing platform designed to help businesses accept online payments, manage transactions, and streamline financial operations. It enables users to handle everything from one-time purchases to recurring billing, while providing detailed insights into revenue, customer behavior, and financial performance. Stripe also integrates with a variety of ecommerce, accounting, and analytics tools, making it easy to fit into existing business systems and workflows.
If your credentials don't include full access to the data source, make sure your access level meets any permission requirements listed in the Specification section of the integration's page in the Metric Library.
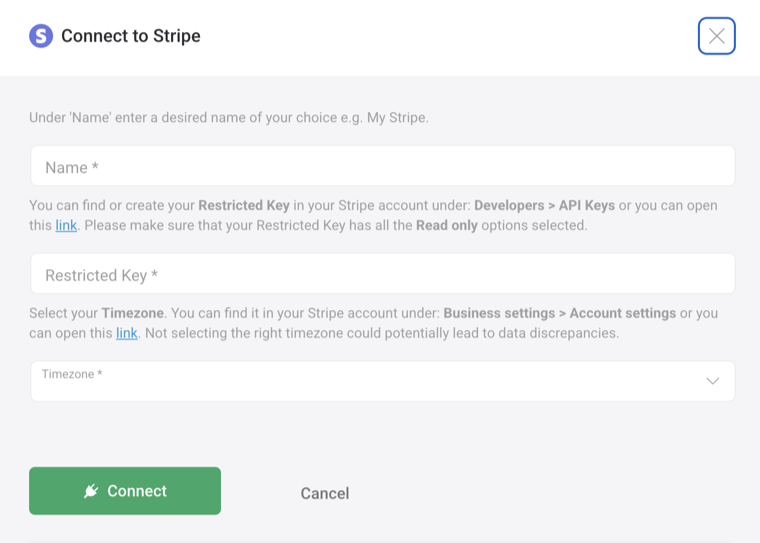
You'll need two pieces of information from your Stripe account:
- Restricted Key – In Stripe, go to Developers > API Keys and create a Restricted Key with Read-only access for all relevant resources.
- Timezone – Found under Business settings > Account settings.
Keep these readily available, as you'll need to enter them in the next step.
To connect Stripe to your Databox account for the first time or with new credentials, enter the Restricted Key and timezone obtained in the previous step.

The Stripe integration supports the creation of datasets, which allow you to structure and format your Stripe data for more flexible reporting in Databox. By organizing your data into a tabular format, datasets make it easier to filter, segment, and visualize key metrics across projects, clients, and team members.
The entity relationship diagram (ERD) below illustrates how data is organized within the Stripe integration, displaying the available views and columns, as well as the relationships between them (primary and foreign keys). This diagram represents the schema, or structure, of the data and helps you understand the underlying data model. With this context, you can create datasets using the relevant views and columns to build custom metrics tailored to your reporting needs.
For comprehensive details on metrics, data availability, templates, specifications, usage guidelines, and other key information, refer to the resources listed below.


FAQ
Do I need a specific Stripe plan to connect with Databox?
No. All Stripe accounts support API key generation regardless of your pricing plan. However, your account must be fully activated to use live data.


