Overview: Metric Insights
Metric Insights allows you to drill down and explore your metric and get more context for it. From the Metric Insights page, you’ll be able to:
- Analyze your metric’s performance over time using an interactive visualization. And easily switch between chart types to select the view that best suits your needs.
- Receive automated updates on your metric’s performance, so you always have the latest information.
- Track goals associated with your metric and monitor your progress towards achieving them.
- Compare your metric’s performance against general benchmarks to identify areas for improvement.
- Make more informed decisions about your strategies using the forecasted value.
The Metric Insights screen is available on all plans. However, features like Forecasts and Performance Summaries are exclusively available to users on Growth and Premium plans. Request a trial of these features by following these steps.
HOW TO
- Access the Metric Insights Page
- Use the Metric Insights Page
- Use your Visualization
- View the Performance Summaries Sidebar
- View the Metric Comparison Section
- View and edit Goals
How to access the Metric Insights Page
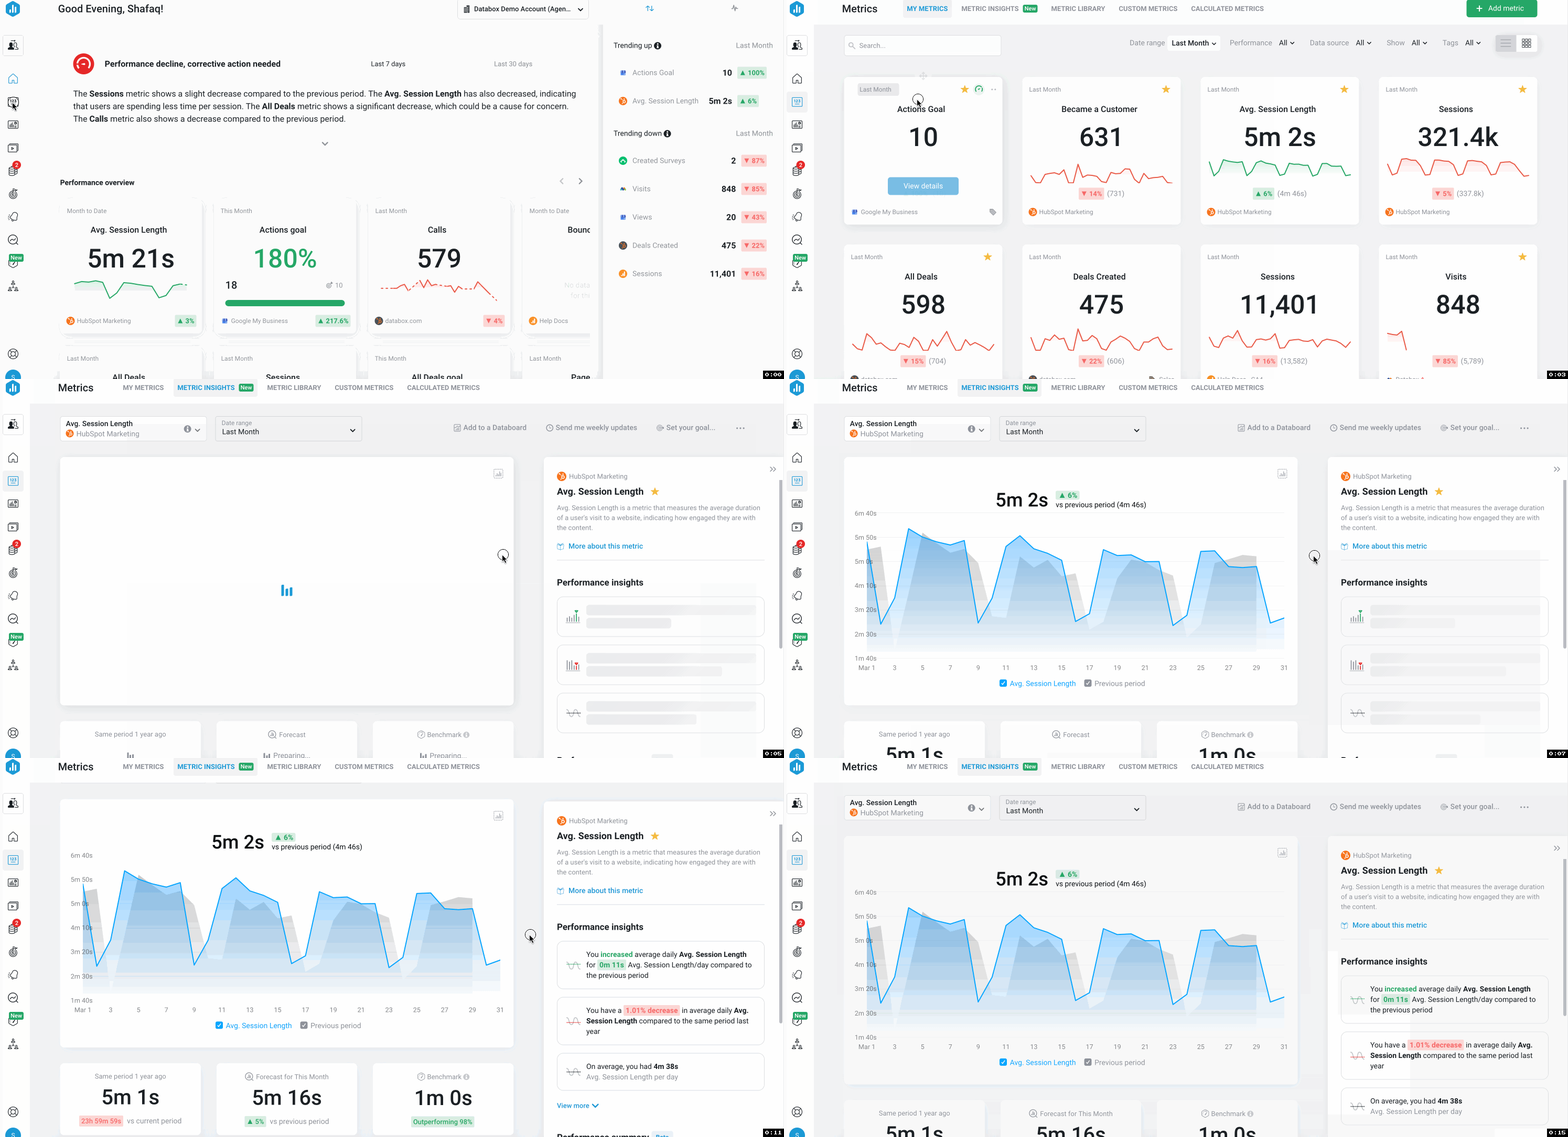
Navigate to Metrics to access the Metrics screen. Hover over the Metric you want to view the insights of and click the blue View details button. This will open the Metric Insights Page for the selected Metric.
You can also access the Metric Insights page directly by navigating to Metrics and clicking on Metric Insights from the navigation bar at the top.
How to use the Metric Insights Page
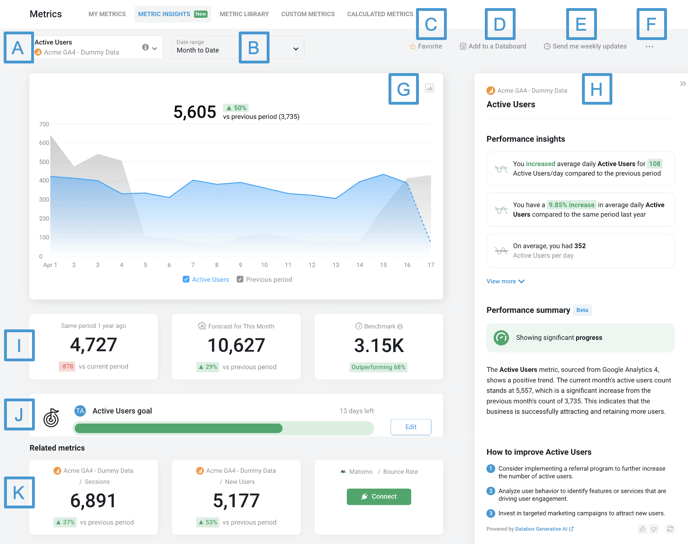
- A) Metric: Select the Metric from the Metric drop-down list. You can filter out metrics for a specific Data Source using the Data Source drop-down. You can further filter the metric's results by using the Metric type drop-down to select between Favorite, Popular, Basic, Custom, and Calculated Metrics.
Pro Tip: By hovering over the i icon next to the metric name, you can view the metric description. You can also view the Data Source details (e.g. name, connection date, connection status, data timezone, user permissions) of the selected metric by clicking on the i icon.
- B) Date Range and graph granularity: Learn how to change the date range and graph granularity below:
- Date Range: Click the Date Range drop-down and select the Date Range that you'd like to view the Metric data for. Learn more about Date Ranges here.
- Graph by: From the Graph by drop-down, you can change the graph's granularity to view the metric's data by day, month, etc. for the selected Date Range. The availability of granularity options for a metric depends on the Data Source's API.
- Cumulative: You can set a cumulative view of the metric's data on the graph from the Cumulative toggle. However, for certain Metrics and Date Ranges, the Cumulative option may be disabled to avoid displaying inaccurate data (e.g. to avoid adding together unique metric values).
- C) Favorite: Click the star icon in the top right corner of the Metric Insights Page. This will add the selected Metric to your Metrics screen.
Pro Tip: This option will only be visible if you haven't already favorited the selected Metric
You can view your Favorite Metrics on your My Metrics page. To filter your favorite Metrics navigate to the Show filter > Favorites.
- D) Add to a Databoard: Click on this to add your Metric to a Databoard. When you click on this, a pop-up window will open where you can select to add this metric to an existing Databoard or a new Databoard.
- E) Send me weekly updates: Click on Send me weekly updates to create the Metric Digest for the Metric. By selecting this option, you will receive detailed Metric performance of this Metric via email every week. Learn more about the Metric Digest here.
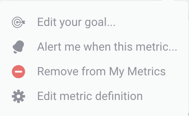
- F) Other options: Click on ... to access more options:
- G) Visualization type: Click on the chart icon to switch the visualization type.
- H) Performance Summaries Sidebar: You can use the Performance Summaries Sidebar to view a detailed summary of your metrics performance. The sidebar will show Metric Description, Performance Insights, Data Summary, and Recommendations.
Learn more about the Performance Summaries Sidebar here. - I) Metric Comparison: Below your chart, you’ll find the Metric Snapshot which features three key data points about your metric which are Compare period, Forecasted value, and Benchmark value.
Learn more about Metric Comparison here. - J) Goal: If you’ve set a goal for your metric, the Goals section will help you see how close you are to reaching your target.
Learn more about Goals here. - K) Related Metrics: The Metrics related to the Metric you have selected will be displayed here.
How to use your Visualization
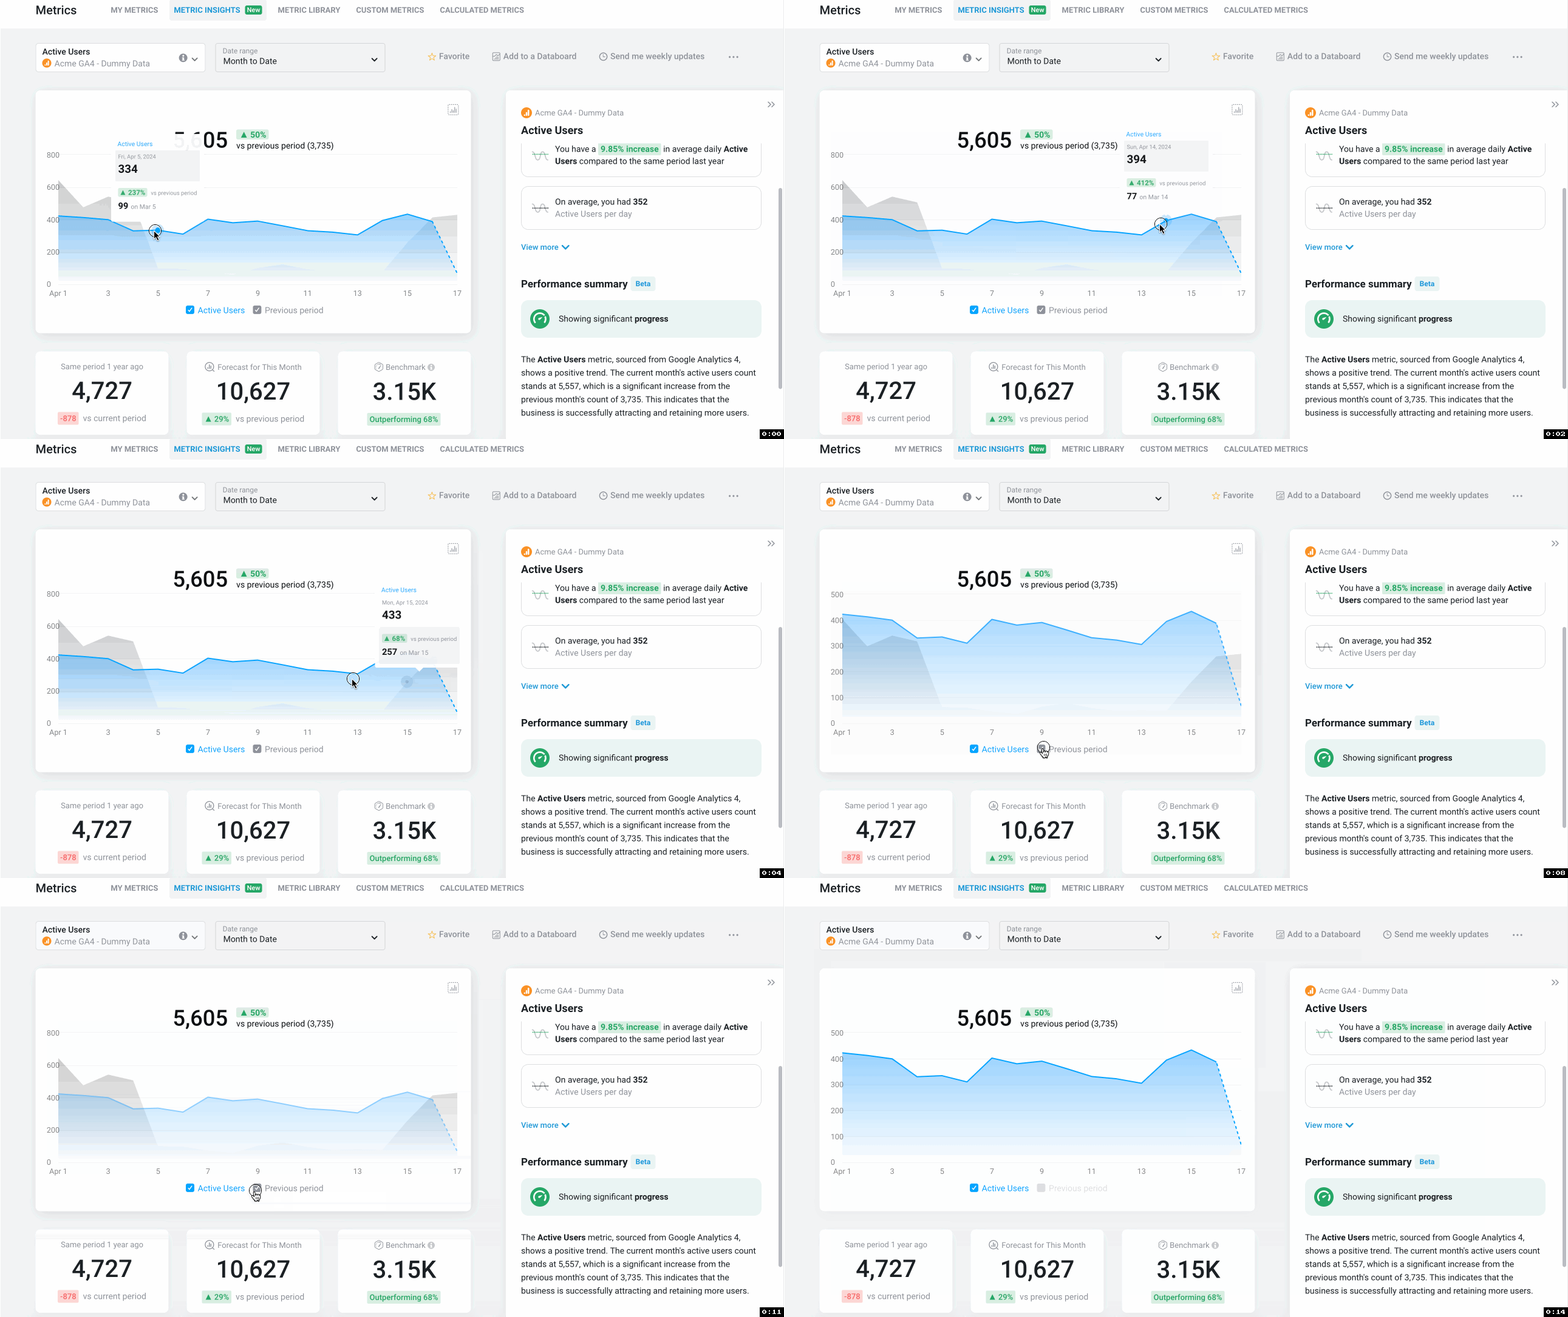
On the Metric Insights Page, you have the ability to view trends for the selected Metric. By hovering over the graph, you can view the individual data points for the Metric.
You can add the comparison line of the Previous period to the selected Metric by clicking the Previous period checkbox. This will help you compare your current performance with the previous period.
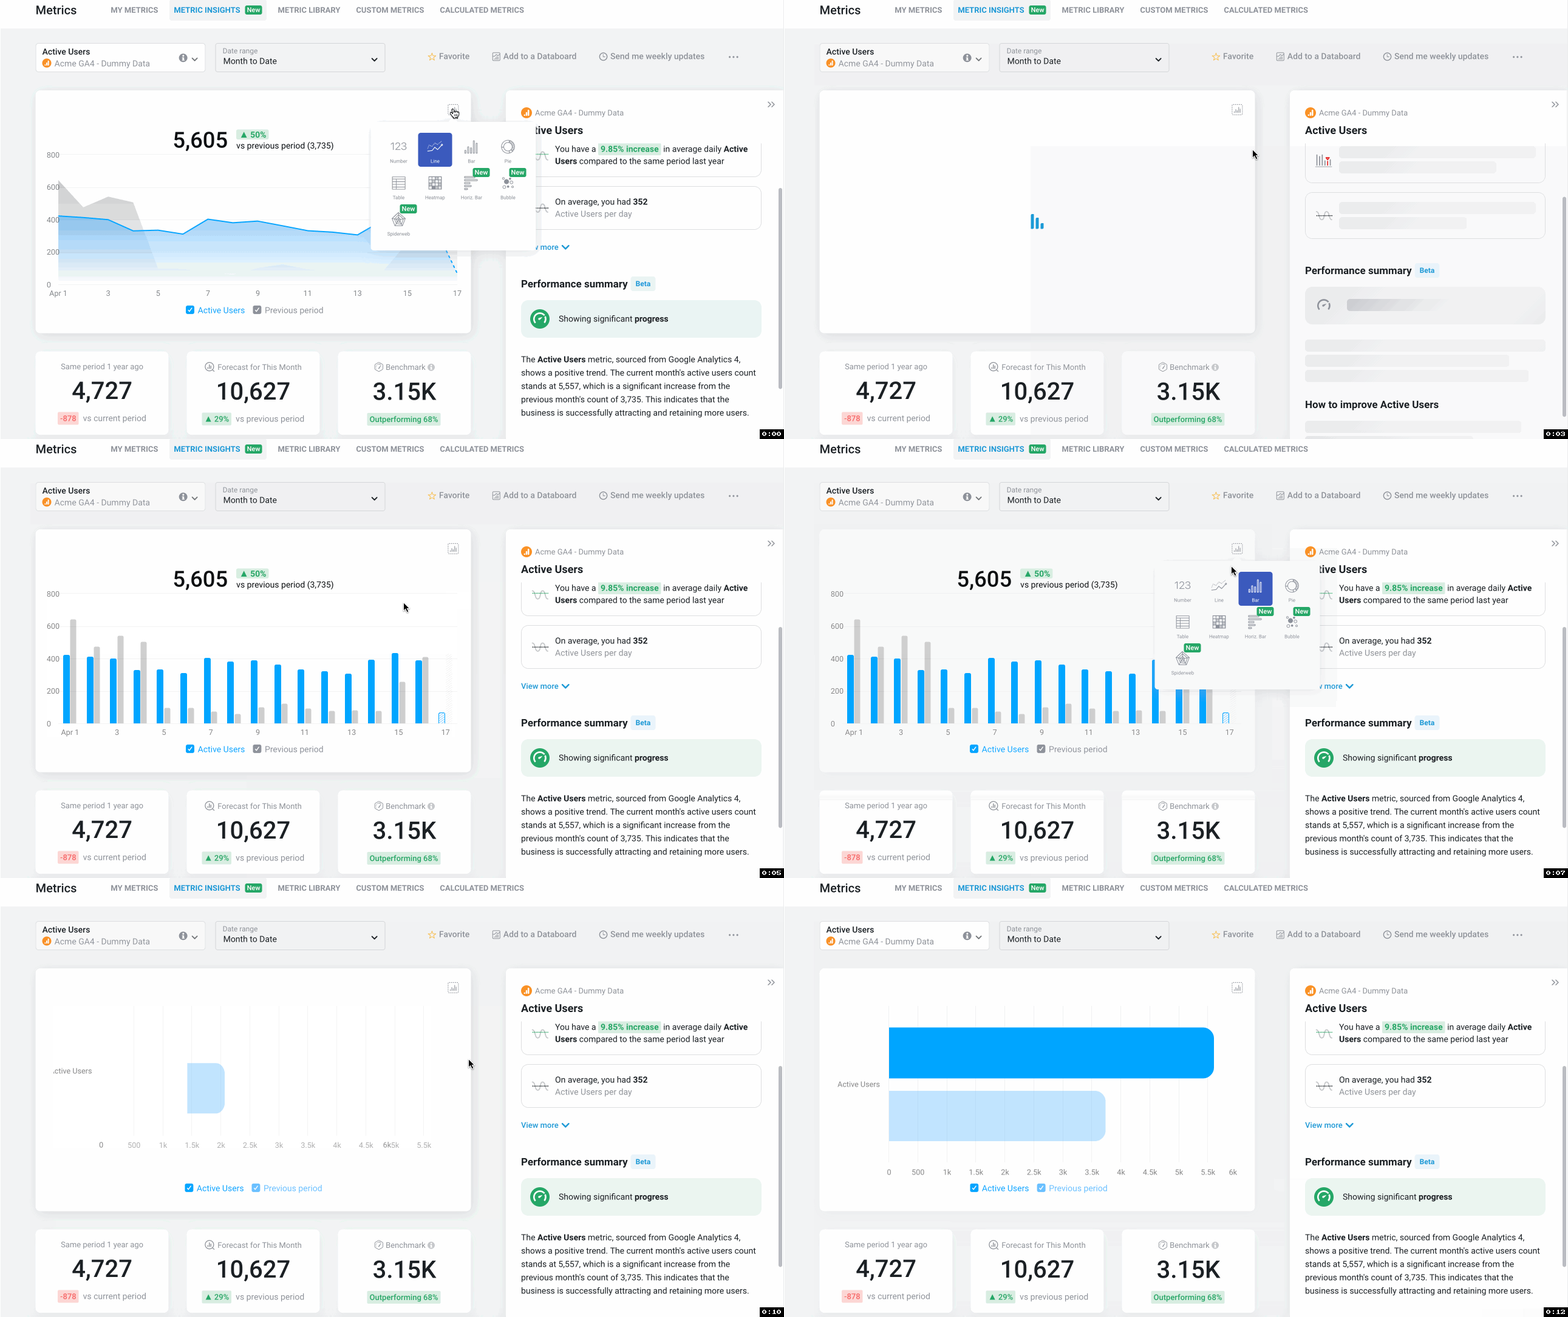
Switch the Visualization type of your chart by clicking on the Chart icon.
Learn more about Visualization types here.
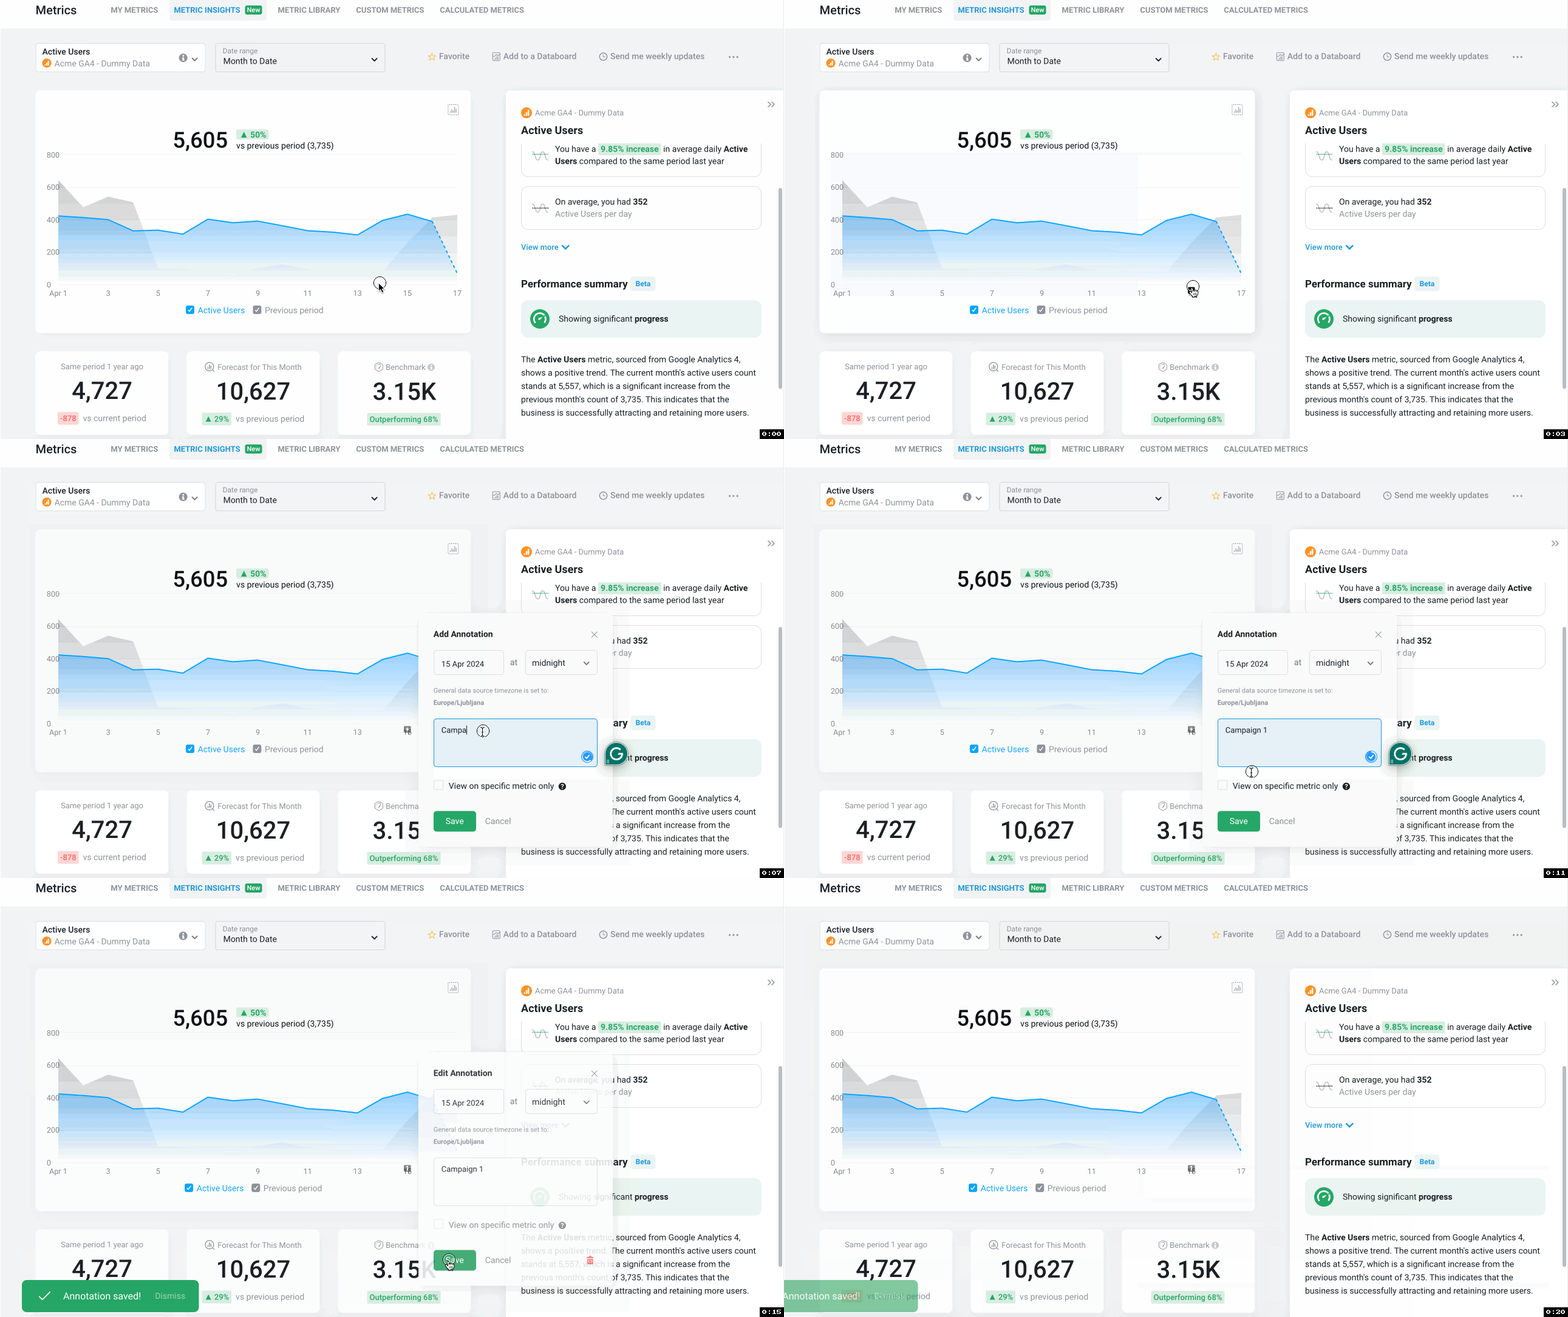
Annotations are short text notices that can be added to charts to better interpret KPIs and inform users when something noticeable has impacted the data. You can add these to your chart by hovering a place on the X-axis of the Line Chart, Bar Chart, or Heat Map where you want to add your Annotation. Click on the + icon on the X-axis to add an Annotation.
Learn more about Annotations here.
How to view the Performance Summaries Sidebar
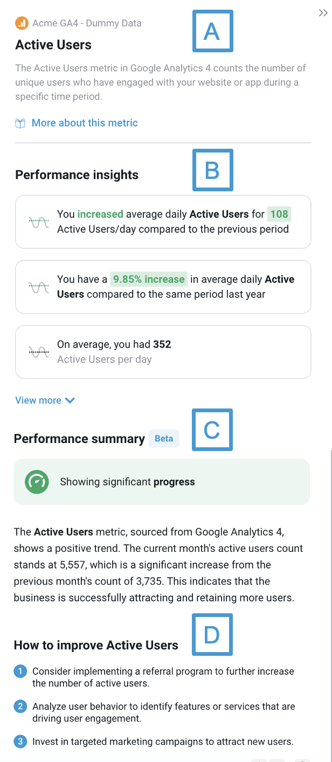
The Performance Summary will not be displayed to users who are not on the Growth and Premium Plan. Request a trial of this feature by following these steps.
- A) Metric Description: You can view the Data source name, Metric name, and a short metric description. For more details about the metric, you can click on the More about this metric button.
- B) Performance Insights: You can use the Performance Insights to quickly spot key changes in your metric’s performance. View the highest value achieved, the lowest value recorded, the overall average value within the chosen timeframe, and more:
- Change relative to the average in the previous period (e.g. You increased average daily sessions for 108 Active Users/day compared to the previous period)
- Percent change relative to the average in the last year (e.g. You have a 9.85% increase in average Active Users compared to the same period last year)
- Average value in that period (e.g. On average, you have 352 Active Users per day)
-
Highest value in that period (e.g. Highest value of 433 was on 15 April)
-
Lowest value in that period (e.g. Lowest value of 67 was on 17 April)
Pro Tip: For Dimensional Metrics, in the Performance Insights you'll be able to view:
-
Dimension with highest positive change (e.g. United States grew the most with 🔼 11.3% change compared to the previous period)
-
Dimension with highest negative change (e.g. Slovenia decreased the most with 🔽 10% compared to the previous period)
-
Dimension with lowest positive change - if none has negative change (e.g. Slovenia grew the least with 🔼 1.3% compared to the previous period)
-
Dimension with highest average value (e.g. United States had the best average daily results with 2,500 Sessions per day.)
-
Dimension with lowest average value (e.g. Slovenia had the worst average daily results with 500 Sessions per day.)
Learn more about Dimensional Metrics here.
- Data Summary: Data summary offers a concise performance overview of the Metric Data summary includes current data for the date range that is chosen for the Metric compared to the previous period.
- Recommendations: View up to 10 recommendations that will help you improve your Metric’s performance.
Pro Tip: Recommendations are not displayed for Calculated Metrics and Custom Metrics.
How to view the Metric Comparison Section
Below your chart, you’ll find the Metric Snapshot featuring three key data points about your metric:
- Compare period: Compare your metric’s current performance to a specific time in the past. Depending on your plan, you’ll be able to compare it to 1 year ago or 6 months ago.
- Forecasted value: See where your current metric performance is leading you. To learn more about the Forecasted value, hover over the value and click on the blue Details button. This will take you to the Metric Forecasts page for the selected Metric.
The Forecasted value will not be displayed for users who are not on the Growth and Premium plans. Request a trial of this feature by following these steps.
- Benchmark value: Learn how well you’re doing compared to established standards. To explore different cohorts, hover over the Benchmark value and click on the blue Details button. This will take you to the Benchmark Explorer for the selected Metric.
Pro Tip: For Dimensional Metrics, you'll be able to view the forecast value of the top 3 performing dimensions here instead of the compare period and the Benchmark value, as shown below:

Learn more about Dimensional Metrics here.
How to view and edit Goals
You can use the Goals section to quickly see how close you are to reaching your target for a specific metric, so you can stay focused and motivated. Click on the Edit button to edit your goal settings.
Learn how to set up Goals here.
Pro Tip: For a Dimensional Metric, all the goals that you've created for the dimensions will be displayed, as shown below:
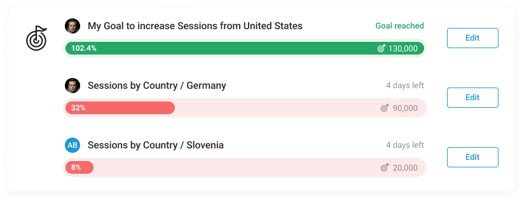
Learn more about Dimensional Metrics here.