
Availability
QuickBooks is accounting software that helps small and mid-size businesses manage their finances — tracking income, expenses, invoices, payroll, and financial reporting in one place. It is widely used to produce balance sheets, profit and loss statements, and cash flow reports that inform day-to-day and strategic decisions. Connecting QuickBooks to Databox makes your financial data available alongside metrics from your sales, marketing, and operations tools, so finance teams can monitor business health, track profitability, and report on financial performance in a unified view.
If your credentials don't include full access to the data source, make sure your access level meets any permission requirements listed in the Specification section of the integration's page in the Metric Library.
To connect QuickBooks to your Databox account for the first time or with new credentials, log in using your Intuit email address, user ID, or phone number.
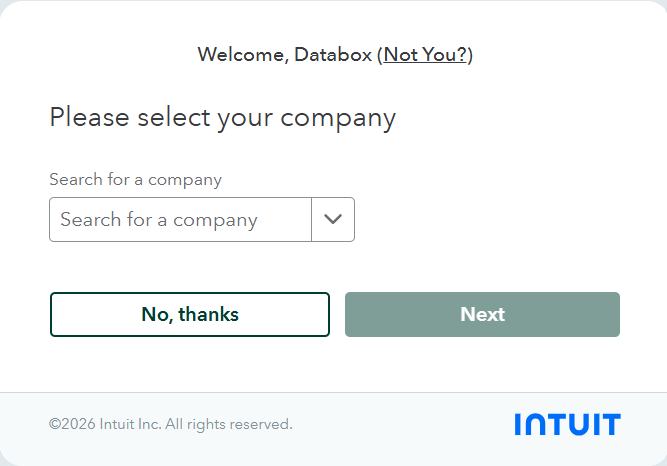
If you manage multiple QuickBooks companies, you'll be prompted to select the specific company you want to connect to Databox. Click Next to authorize the connection.
The QuickBooks integration allows you to create custom metrics using the metric builder.
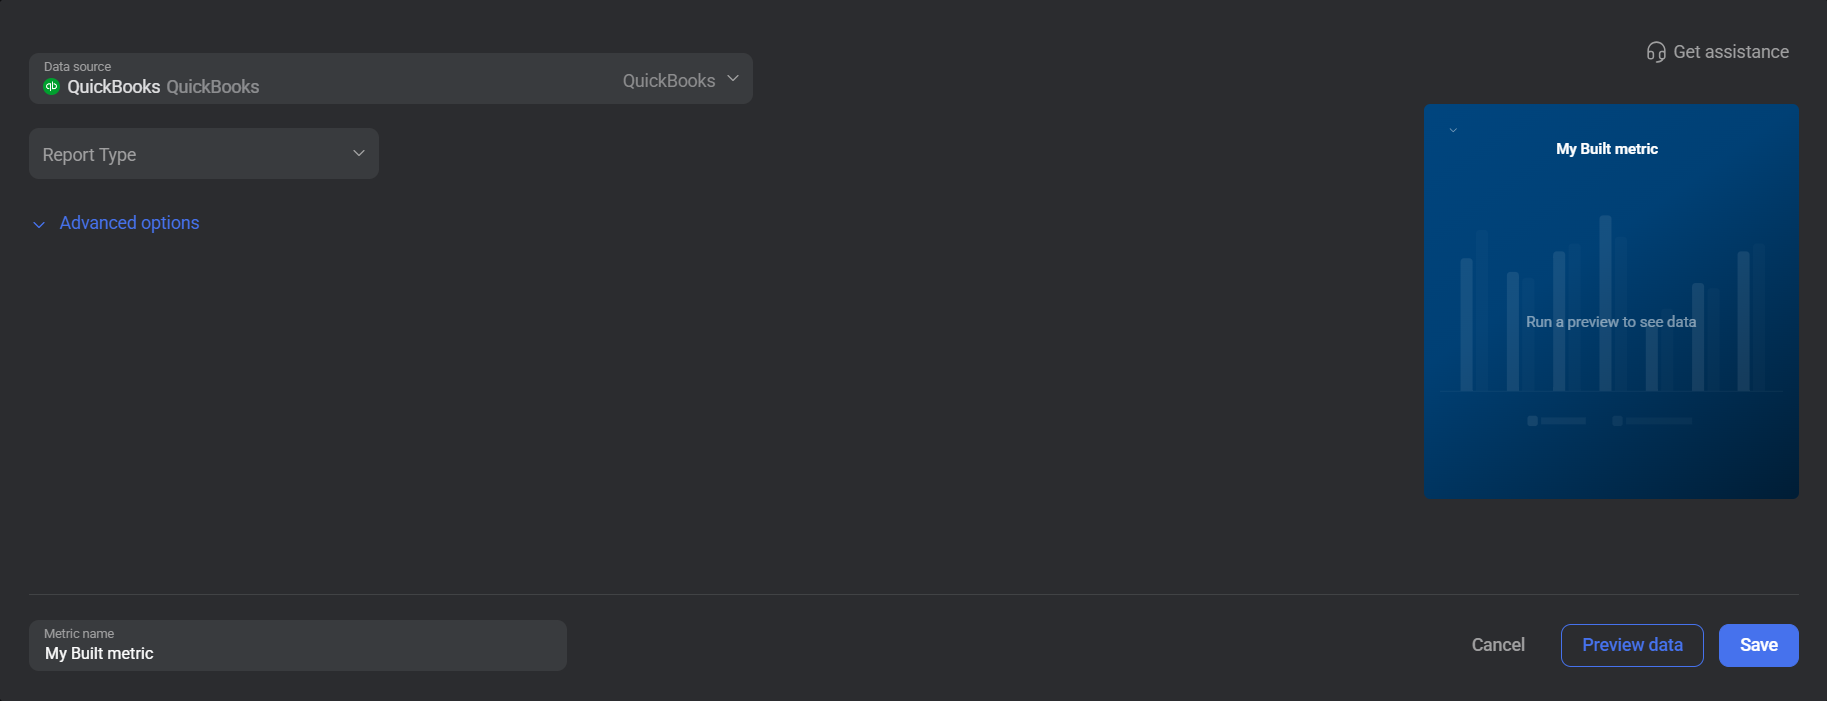
To create a custom metric, select a Report Type and the specific Metric you want to track. Use the available options to configure the accounting method, add a dimension, and apply one or more filters.
The report types available for metric creation are listed below.
The Balance Sheet report type provides a snapshot of financial position at a point in time, capturing the company's assets, liabilities, and equity. From this data, finance teams can assess solvency, monitor how total liabilities are shifting relative to assets, and track ownership equity across reporting periods.
 In QuickBooks: Go to Reports and open the Balance Sheet report to view the data this report type exposes.
The Profit and Loss report type summarizes revenue, costs, and expenses over a selected period, showing how much the business earned or lost. From this data, finance teams can measure gross and net profitability, identify cost trends, and evaluate operational performance across different time frames.
In QuickBooks: Go to Reports and open the Profit and Loss report to view the data this report type exposes.

The QuickBooks integration supports the creation of datasets, which allow you to structure and format your QuickBooks data for more flexible reporting in Databox. By organizing your data into a tabular format, datasets make it easier to filter, segment, and visualize key metrics across projects, clients, and team members.
The entity relationship diagram (ERD) below illustrates how data is organized within the QuickBooks integration, displaying the available views and columns, as well as the relationships between them (primary and foreign keys). This diagram represents the schema, or structure, of the data and helps you understand the underlying data model. With this context, you can create datasets using the relevant views and columns to build custom metrics tailored to your reporting needs.
For comprehensive details on metrics, data availability, templates, specifications, usage guidelines, and other key information, refer to the resources listed below.


FAQ
Is QuickBooks Desktop supported?
No. The Databox integration is only compatible with QuickBooks Online.
What does 'Adjust gain and loss' do in the metric builder?
Enabling this option includes unrealized gains and losses in the report data. Unrealized gains and losses arise from changes in the value of assets — such as foreign currency holdings or investments — that have not yet been sold or settled. Leave this disabled if you want to report on realized figures only.
What is the difference between Accrual and Cash accounting methods?
Accrual accounting records income when it is earned and expenses when they are incurred, regardless of when cash is received or paid. Cash accounting records transactions only when cash actually changes hands. The same metric can return different values depending on the method selected, so use the method that matches how your business reports its financials.


