
Availability
Pinterest Ads is a visual advertising platform that enables businesses to reach high-intent audiences who are actively searching for ideas, products, and inspiration. Unlike traditional social networks, Pinterest users engage with content specifically because they are planning purchases or projects, making it a strong channel for discovery-led campaigns. Connecting Pinterest Ads to Databox lets you monitor campaign performance, track spend efficiency, and build dashboards that surface ad analytics and report data alongside your other paid channels — all in one place.
If your credentials don't include full access to the data source, make sure your access level meets any permission requirements listed in the Specification section of the integration's page in the Metric Library.
If you've already established a connection, you can reuse it to add new accounts, as long as those accounts are accessible with the existing connection's credentials.
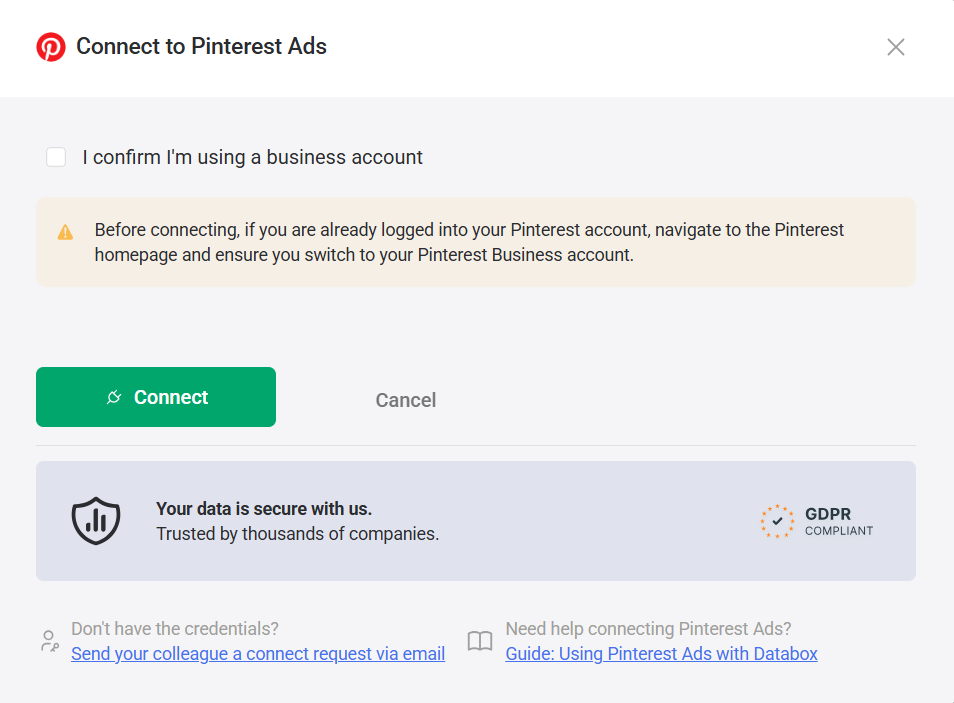
- In the Databox connect modal, check the I confirm I'm using a business account checkbox. Before connecting, make sure you are logged in to Pinterest as your Business account. If you are already logged in with your personal account, navigate to the Pinterest homepage and switch to your Business account first.
- Click Connect.
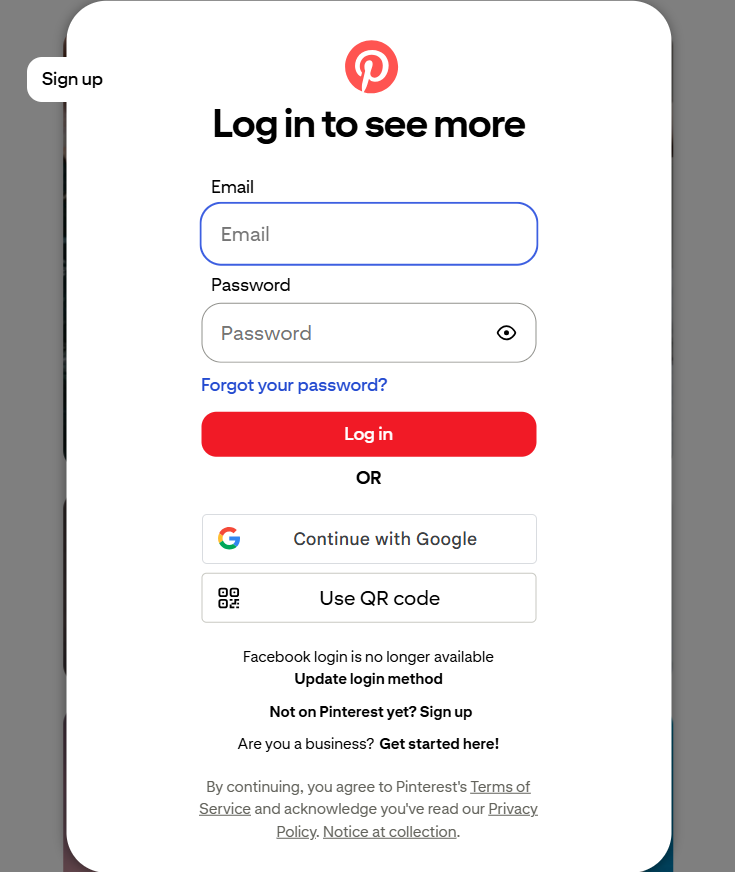
Sign in with your Pinterest email and password, or choose Continue with Google or Use QR code.
Choose the Pinterest Ads account you want to report on. If you manage multiple ad accounts, you will be prompted to select the specific account you want to connect to Databox.
Select the conversion window — the number of days after a click or engagement view in which a conversion is counted. This setting must match your Pinterest Ads account configuration so that data in Databox aligns with what you see in Pinterest.
The Pinterest Ads integration allows you to create custom metrics using the metric builder, ideal for visualizing data not included in the basic metrics offered by the integration.
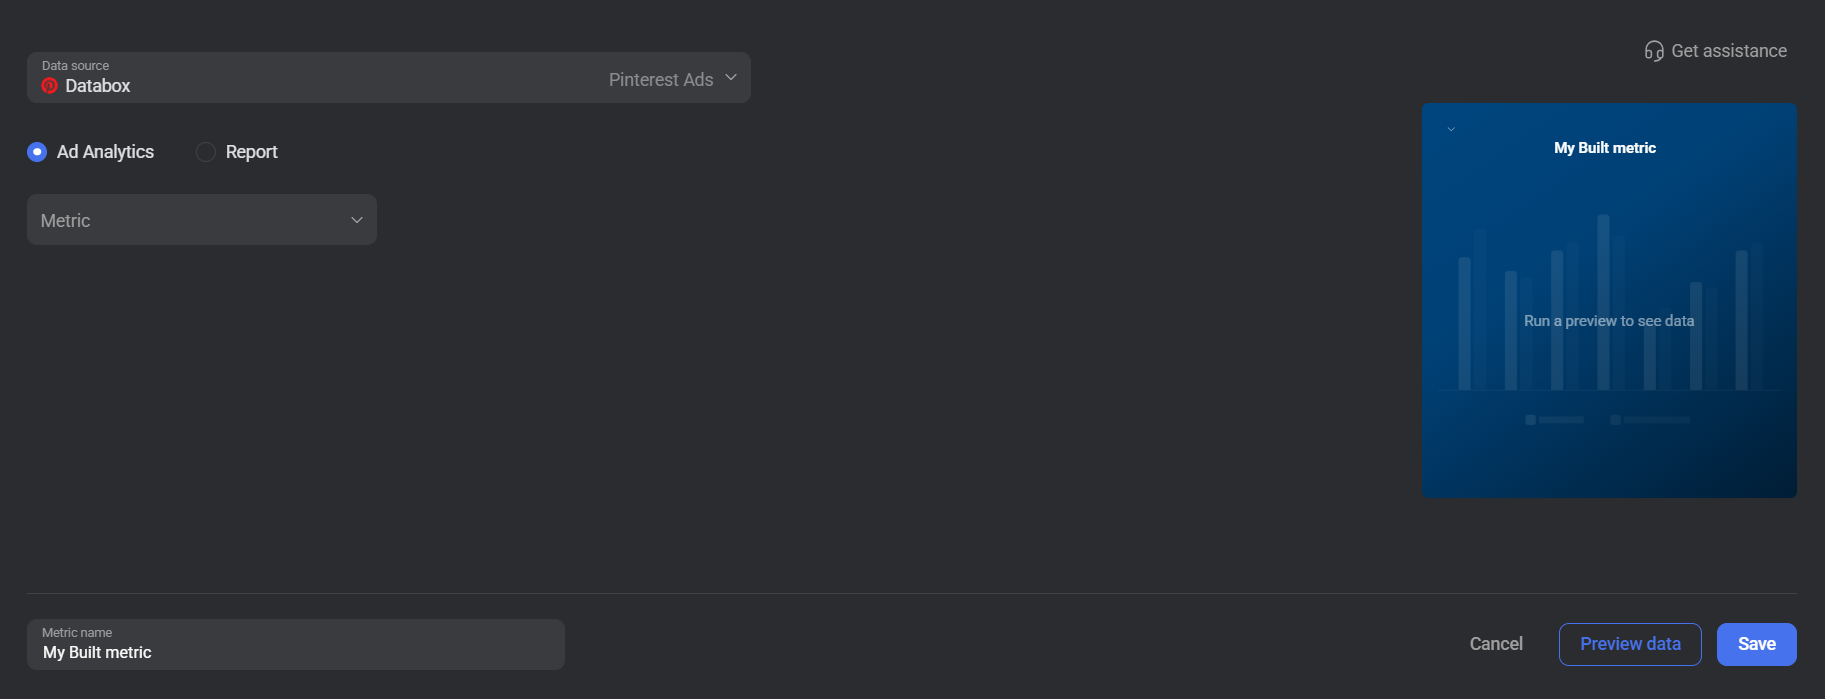
To create a custom metric, start by selecting a metric from the Metric selector. Next, customize your metric by optionally adding a dimension and applying one or more filters. The available options depend on the selected entity and data type (e.g., number, text, etc.).
The Pinterest Ads metric builder offers two modes: Ad Analytics and Report. Each mode gives access to a different set of entities and metrics.
Ad Analytics provides pin-level performance data for individual ads. Use this mode to track metrics such as engagement rate, spend, impressions, 3-second video views, and other ad-level signals. After selecting a metric, you can set the Conversion Report Time to anchor your data on either the time of the ad action or the time of conversion.
 In Pinterest Ads: Go to the Ads Manager and select the Ads tab.
Report mode provides aggregated data broken down by the entity type you select from the Type dropdown. The available types are Ad Account, Ad Groups, and Campaigns. After selecting a type and metric, you can optionally add a dimension, apply filters (such as campaign status or objective type), and set the Conversion Report Time.
Provides aggregated metrics for the entire ad account. Use this type to get a top-level view of total spend, impressions, and conversions across all campaigns and ad groups running in the account.
In Pinterest Ads: Go to the Ads Manager and select the Overview tab.
Provides metrics at the ad group level, allowing you to analyze performance and compare targeting strategies across different ad groups within your campaigns.
In Pinterest Ads: Go to the Ads Manager and select the Ad groups tab.
Provides metrics at the campaign level, making it easy to track spend, ROAS, and performance for each individual campaign and compare results across your marketing objectives.
In Pinterest Ads: Go to the Ads Manager and select the Campaigns tab.

The Pinterest Ads integration supports the creation of datasets, which allow you to structure and format your Pinterest Ads data for more flexible reporting in Databox. By organizing your data into a tabular format, datasets make it easier to filter, segment, and visualize key metrics across projects, clients, and team members.
The entity relationship diagram (ERD) below illustrates how data is organized within the Pinterest Ads integration, displaying the available views and columns, as well as the relationships between them (primary and foreign keys). This diagram represents the schema, or structure, of the data and helps you understand the underlying data model. With this context, you can create datasets using the relevant views and columns to build custom metrics tailored to your reporting needs.
For comprehensive details on metrics, data availability, templates, specifications, usage guidelines, and other key information, refer to the resources listed below.


FAQ
What does the Conversion Report Time setting control?
The Conversion Report Time option determines how conversion data is attributed in your custom metric. Choosing Time of Ad Action counts conversions based on when the user interacted with your ad, while Time of Conversion counts them based on when the conversion event actually occurred. This setting is available in both Ad Analytics and Report modes. Learn more in the Pinterest Help Center.
What is the difference between Ad Analytics and Report in the metric builder?
Ad Analytics provides pin-level performance data pulled directly from individual ad records, without dimension segmentation. Report mode lets you select a type (Ad Account, Ad Groups, or Campaigns) and optionally apply dimensions and filters, making it better suited for segmented or aggregated views of your performance data.
Why do I need a Pinterest Business account to connect?
The Pinterest Ads API only grants access to advertising data for business accounts. Personal accounts do not have access to Ads Manager or the underlying API endpoints that Databox uses to sync campaign data. You can convert your personal account to a business account for free at pinterest.com/business/convert.


