
Amplitude is a product analytics platform that helps businesses understand how users interact with their digital products. It tracks events, user journeys, funnel conversions, and retention patterns across web and mobile applications, giving product and growth teams the data they need to make informed decisions. Connecting Amplitude to Databox brings your product analytics alongside data from your marketing, sales, and support tools, so you can monitor user engagement, measure feature adoption, and track conversion performance in a unified view.
If your credentials don't include full access to the data source, make sure your access level meets any permission requirements listed in the Specification section of the integration's page in the Metric Library.
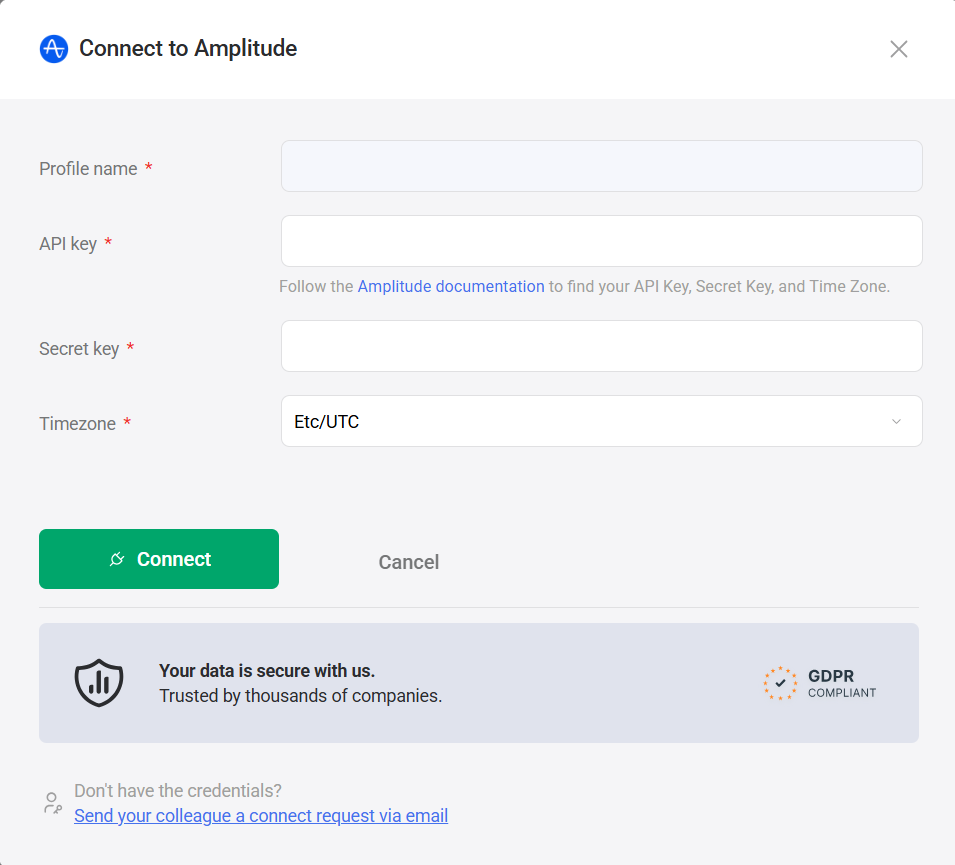
Databox uses your Amplitude API Key and Secret Key to authenticate the connection. Follow Amplitude's official documentation to locate your API Key, Secret Key, and the time zone configured for your Amplitude account.
- Enter a name for the connection in the Profile name field.
- Paste your Amplitude API Key into the API key field.
- Paste your Amplitude Secret Key into the Secret key field.
- Set the Timezone to match the time zone configured in your Amplitude account.
- Click Connect.
The Amplitude integration allows you to create custom metrics using the metric builder, ideal for visualizing data not included in the basic metrics offered by the integration.
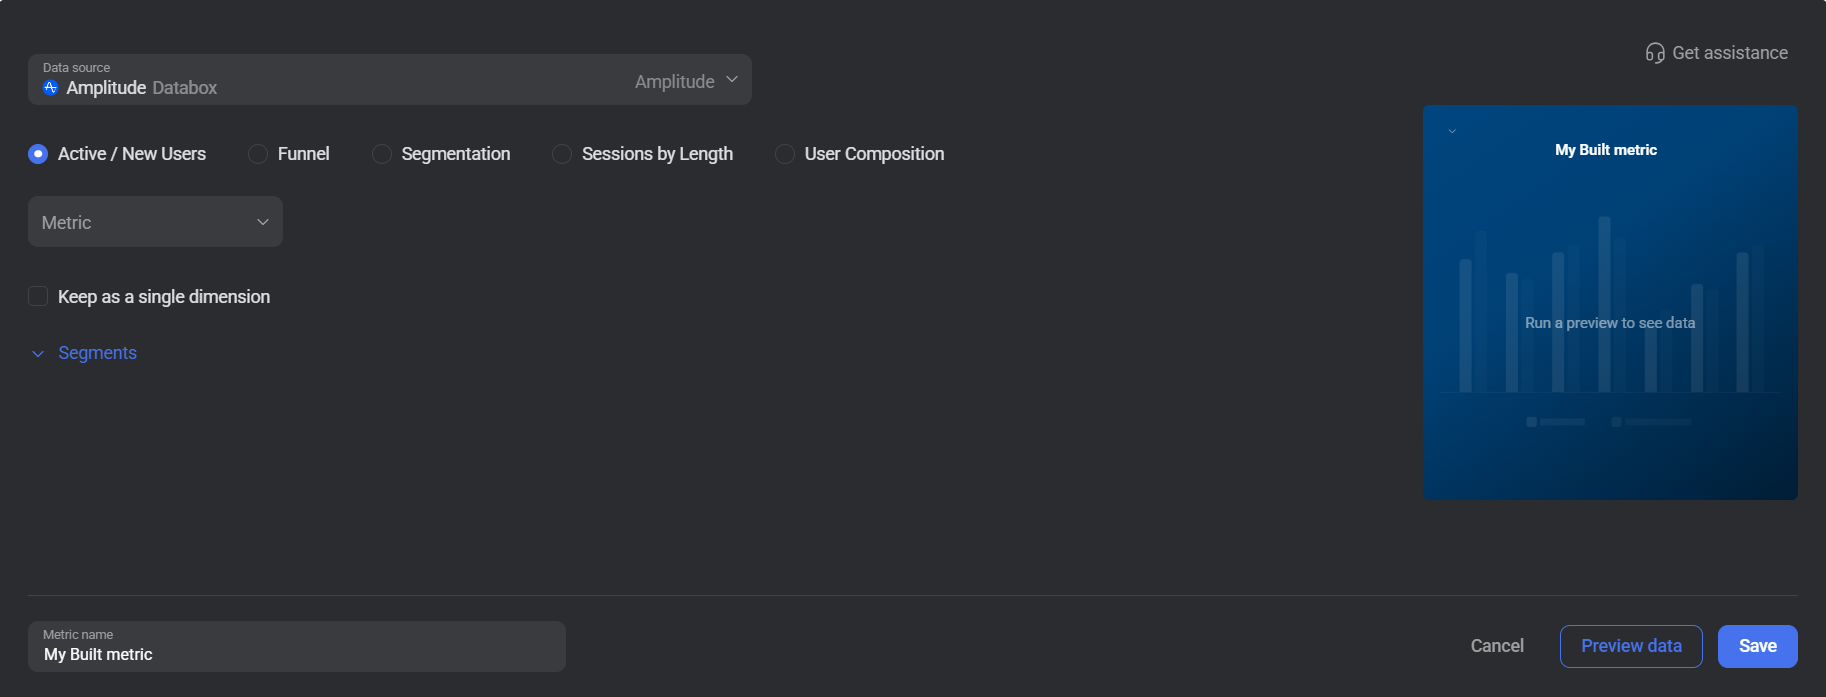
To create a custom metric, select an entity type from the radio buttons at the top of the metric builder. Each entity type exposes different fields based on the kind of analysis you want to perform.
The entity types available for metric creation are listed below.
The Active / New Users entity lets you measure how many users were active or new within a given time period. Use it to track user growth and engagement trends, optionally broken down by a user property.
Select a Metric (Active Users or New Users). Use the Segments section to add one or more property filters — each row defines a Property, Operator, and Values.
 In Amplitude: Go to the Users section to browse the user properties available for grouping and filtering.
The Funnel entity measures conversion rates across a defined sequence of events. Use it to understand how many users complete each step of a flow and where drop-offs occur.
Add one or more events using the Funnel Steps rows. Choose a User Type and a Mode. Optionally specify a Conversion Window to restrict the analysis to events occurring within a given time frame. Select a Dimension (Optional) to break results down by a property. Use the Filters section to apply entity-level filters and the Segments section to apply property-level filters.
In Amplitude: Go to Analytics > Funnel Analysis to find and review the events that make up your funnels.
The Segmentation entity lets you measure any event metric with optional rolling calculations and property-level filtering. Use it to track event totals, averages, or unique counts for any event in your Amplitude account.
Select an Event from your Amplitude account. Optionally apply a Rolling Operator to calculate a rolling average or rolling window value. Use the Segments section to add property-level filters.
In Amplitude: Go to Analytics > Segmentation Analysis to explore the events and properties available in your account.
The Sessions by Length entity groups session data into configurable time buckets, letting you analyze the distribution of session durations across your user base.
Select a Dimension to define the time unit for the buckets. Enter a Min Bucket Value and Max Bucket Value to define the range. Optionally specify a Bucket Size to control how many buckets are created within the range.
The User Composition entity lets you analyze the makeup of your user base by breaking down a user metric by a chosen dimension. Use it to understand how your users are distributed across dimensions such as country, region, or app version.
Select a Metric (such as Users) and a Dimension to segment the results. If no dimension is selected, the metric returns a single aggregated value per date range.
For comprehensive details on metrics, data availability, templates, specifications, usage guidelines, and other key information, refer to the resources listed below.


FAQ
Does the time zone setting affect how data appears in Databox?
Yes. Amplitude data syncs in the time zone configured in your Amplitude account. Set the Timezone field during connection to match your Amplitude account's time zone to avoid discrepancies between what you see in Amplitude and in Databox.
Why does date range data from Amplitude differ from what I see in Databox?
Amplitude counts "last X days" as the X days preceding today, while Databox includes today in its count. For example, selecting the last 2 days in Amplitude corresponds to selecting the last 3 days (including today) in Databox. Adjust your Databox date range accordingly when comparing values between the two tools.


