
Ahrefs is a comprehensive SEO and marketing analytics platform designed to help you improve your website's search visibility and performance. It provides in-depth data on backlinks, keywords, and organic rankings, along with competitive analysis tools to identify opportunities and monitor progress. By using Ahrefs, marketers and SEO professionals can make data-driven decisions to increase traffic and strengthen their online presence.
If your credentials don't include full access to the data source, make sure your access level meets any permission requirements listed in the Specification section of the integration's page in the Metric Library.
To connect Ahrefs to your Databox account for the first time, enter the following parameters to define how Databox will pull data from Ahrefs:
- Target domain — Enter the domain or URL you want to analyze.
Examples:www.example.comorexample.com. - Mode — Specify the mode of operation. Available options are:
exact— For an exact match of the entered URL.domain— For the entire domain, excluding subdomains.subdomains— For the domain and all its subdomains.prefix— For all URLs starting with the specified prefix.
- Data limit — Define how many items (e.g., pages, keywords, backlinks, domains, anchors, or countries) Databox should fetch per metric.
- Acceptable range: 3–100
- Default value: 50
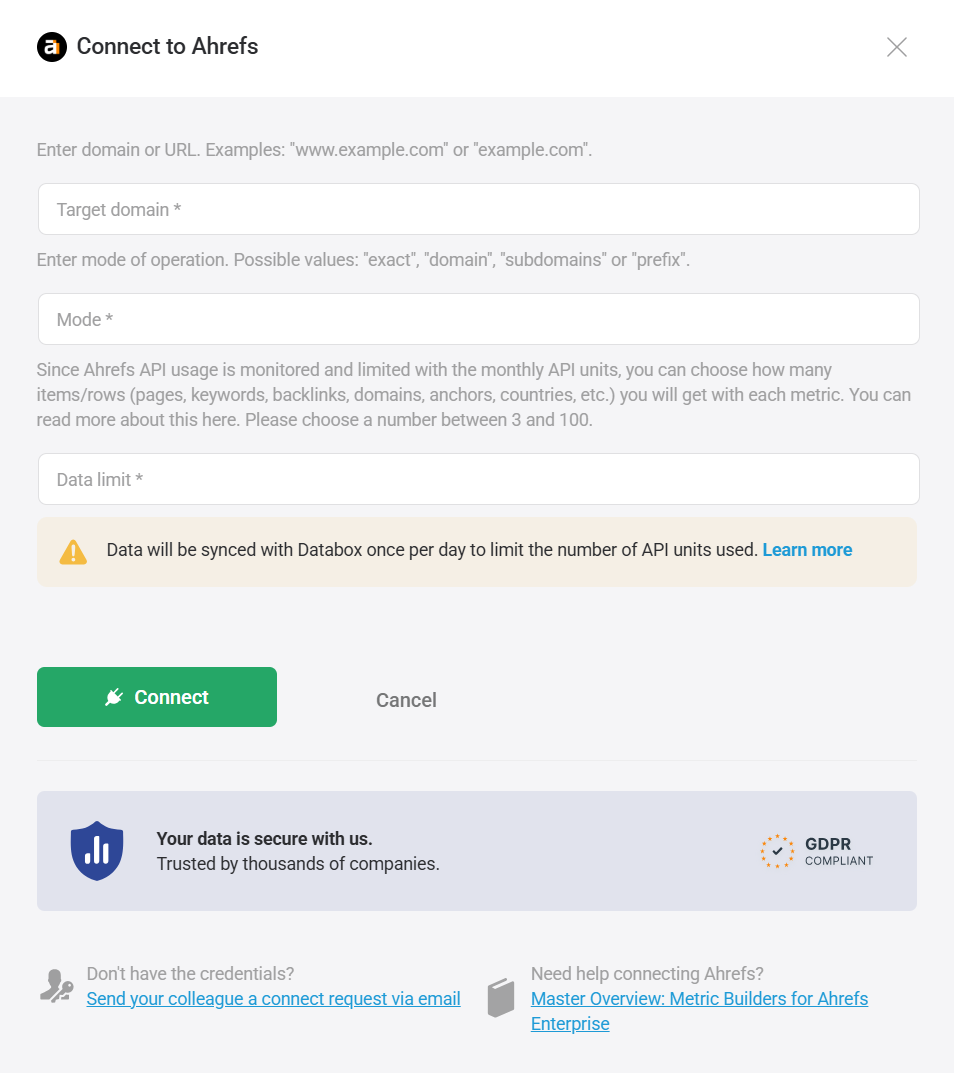
After entering all parameters, click Connect. You'll be redirected to sign in to your Ahrefs account and authorize Databox to access your data.
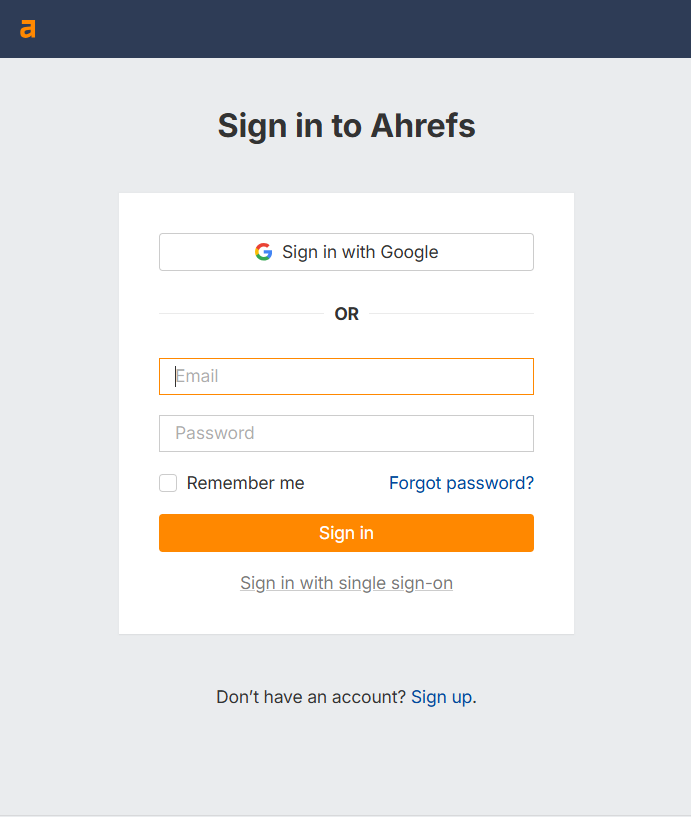
Once authorization is complete, the connection will be established, and your Ahrefs data will be available in Databox.
The Ahrefs integration allows you to create custom metrics using the metric builder, ideal for visualizing data not included in the basic metrics offered by the integration.
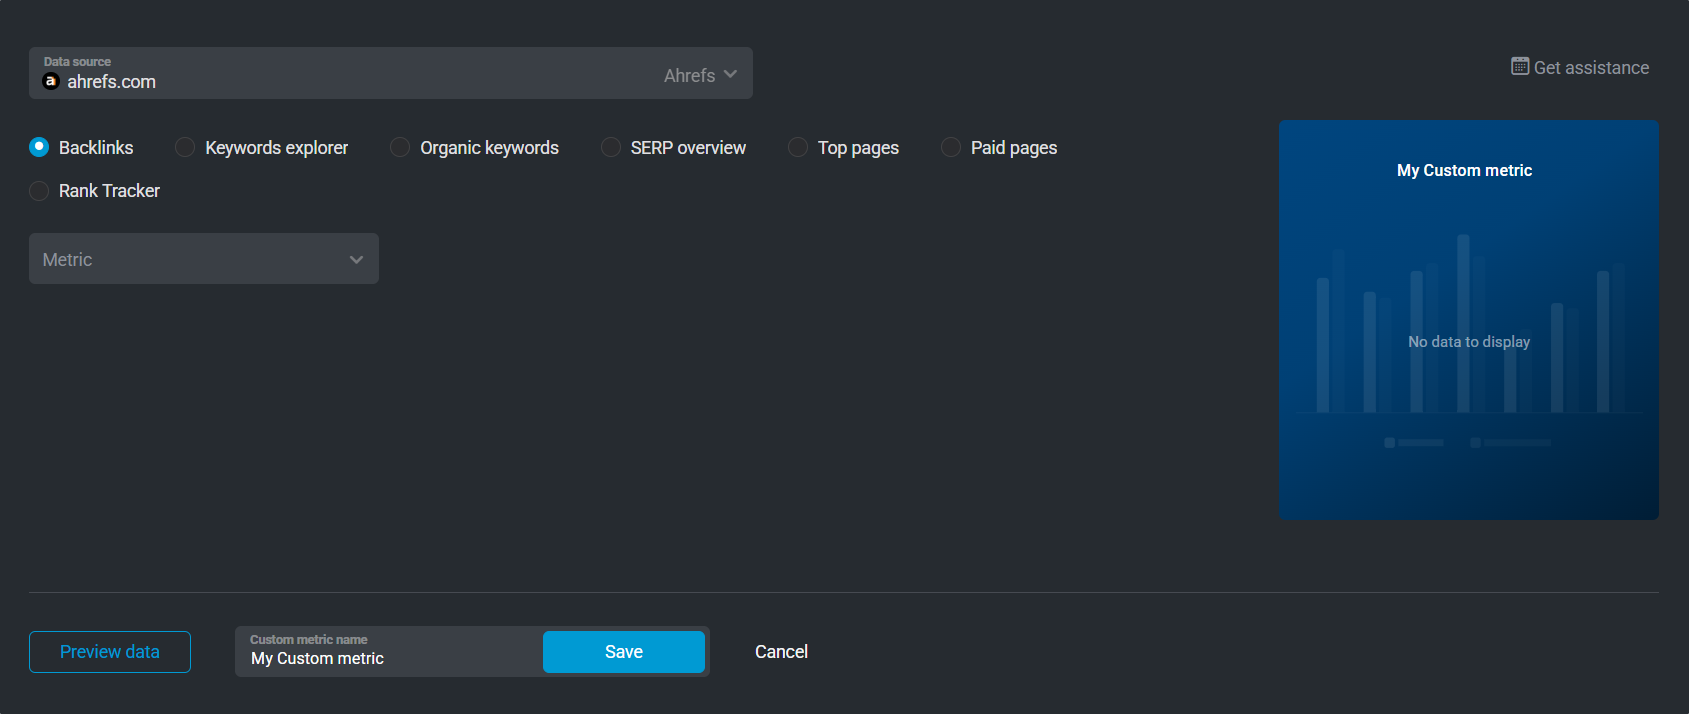
To create a custom metric, start by selecting a metric from the "Metric" selector. Next, customize your metric by optionally adding a dimension and applying one or more filters.
There are several entities available for custom metric creation: Backlinks, Keywords explorer, Organic keywords, SERP overview, Top pages, Paid pages,and Rank Tracker.
Analyze backlink data for your target domain or URL, including Ahrefs Rank, Domain Rating, Referring Domains, Traffic, and Link Type. You can further break down metrics by dimensions such as Anchor, Alt Text, Link Type (text, image, redirect, etc.), or Drop Reason to identify lost or broken links.
 In Ahrefs: Go to the Site Explorer → Backlinks section.
Explore detailed keyword metrics such as Search Volume, Keyword Difficulty, CPC, Clicks, Click Rate (organic or paid), and Traffic Potential. Use dimensions like Keyword, Parent Topic, or SERP Features (e.g., snippet, image, video) to segment data by keyword type or intent.
In Ahrefs: Go to the Keywords Explorer tool.
View the organic keywords your domain or URL ranks for, including metrics like Keyword Difficulty, Search Volume, Traffic, Best Position, and SERP Features Count. You can analyze positions by Keyword, Language, or Position Kind (e.g., snippet, paid top, organic).
In Ahrefs: Go to the Site Explorer → Organic Keywords section.
Review how pages rank in SERPs for specific keywords. Access metrics such as Ahrefs Rank, Position, Domain Rating, Traffic, and Referring Domains. Dimensions like Title, Top Keyword, and URL help you identify high-performing competitors or ranking opportunities.
In Ahrefs: Go to the Keywords Explorer → SERP Overview section.
Identify which pages generate the most organic traffic. Available metrics include Sum Traffic, Top Keyword Volume, Top Keyword Best Position, Value, and Keywords Count. Dimensions such as URL, Top Keyword, and Country provide insights into top-performing pages across regions.
In Ahrefs: Go to the Site Explorer → Top Pages section.
Analyze paid search performance, including Ads Count, Sum Traffic, Top Keyword Best Position, Top Keyword Volume, and Value. Segment your data by Keyword, Country, or Ad Type to understand paid campaign results.
In Ahrefs: Go to the Site Explorer → Paid Pages section.
Monitor tracked keywords and ranking progress over time. Access metrics such as Position, Search Volume, Clicks, Traffic, CPC, and Clicks Per Search (CPS). Use dimensions like Keyword, Country, or URL to evaluate performance by region or page.
In Ahrefs: Go to the Rank Tracker tool.
For comprehensive details on metrics, data availability, templates, specifications, usage guidelines, and other key information, refer to the resources listed below.


FAQ
How can I monitor my Ahrefs API credit usage?
You can track your Ahrefs API credit consumption directly in Ahrefs by visiting the Limits & usage page, or in Databox using dedicated API usage metrics.
Available metrics include:
- Time to API usage reset — shows when your API usage will reset.
- Time to API key expiration — displays when your current key will expire.
- Workspace API limit — indicates the total number of API units available in your workspace.
- Workspace API usage — tracks how many units have been used so far.
- API key usage — monitors usage specific to the connected API key.
These metrics help ensure you stay within your monthly API allocation and manage your data requests efficiently.


