
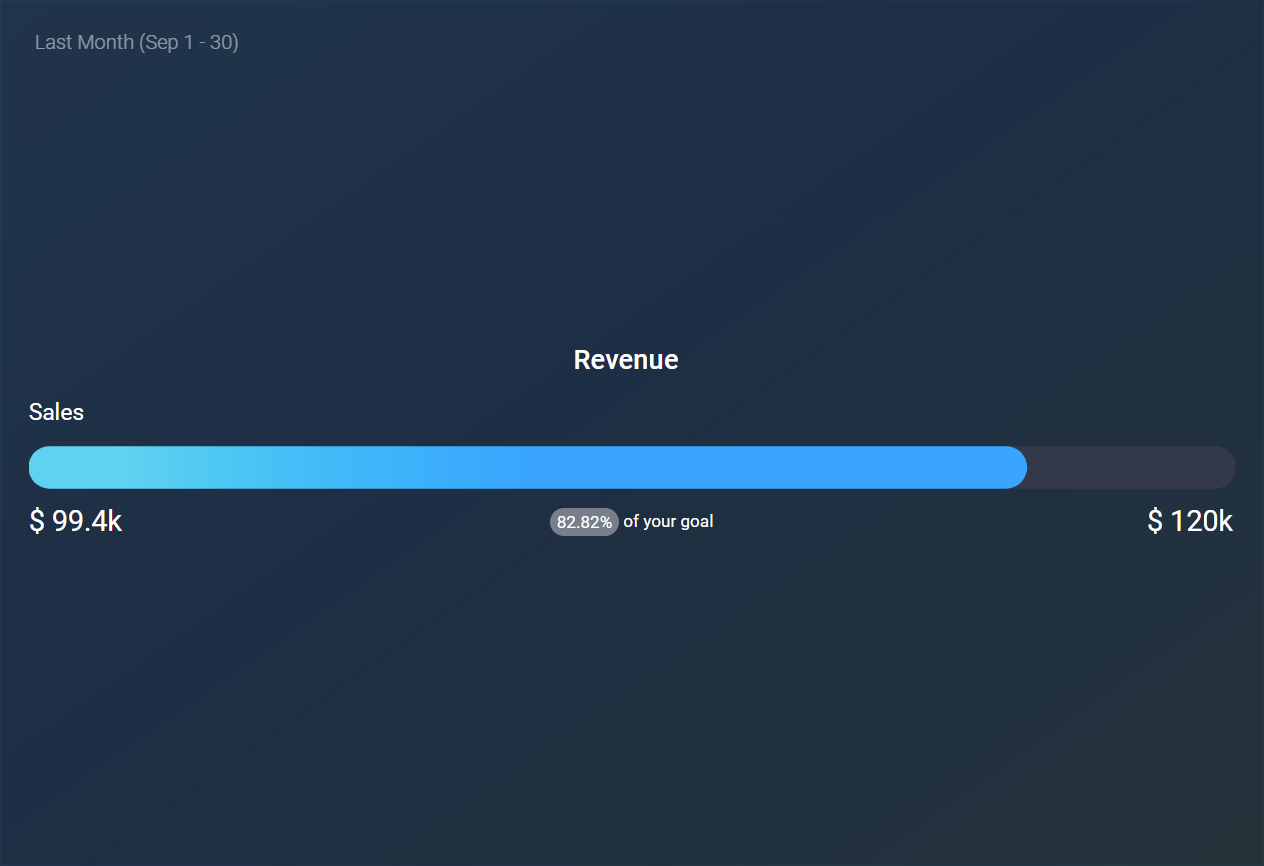
The Progress visualization displays a single linear bar that illustrates a metric's progress toward a defined target, ideal for monitoring goal completion. This visual representation provides a clear view of advancement over time, allowing users to gauge performance against benchmarks or goals directly. It's often used in business settings where progress tracking on key metrics—such as sales quotas, completion rates, or customer sign-ups—is crucial.
The following key functionalities are offered by the Progress visualization:
- Maximum value can be set to calculate automatically, or be aligned to an existing goal, metric, or custom value.
- The text displayed at the start of the bar is customizable.
- Traffic light coloring is available to visually indicate progress toward a target or maximum.
- The color gradient is determined by the selected color theme.
- Comparisons against other periods are not supported in this visualization.
- This visualization displays data for only one metric or dimension at a time.
The Progress visualization is particularly useful in scenarios such as:
- Sales and Revenue Tracking: Monitor progress toward monthly or quarterly sales targets.
- Customer Acquisition: Track sign-ups or retention goals against set benchmarks.
- Project Management: Visualize completion rates for project milestones and deadlines.
- Performance Targets: Measure team or individual achievements against KPIs.
- Operational Metrics: Track fulfillment of inventory or production quotas over a period.


