Understanding the Number visualization
Explore how the Number visualization displays key metrics and trends, enabling quick insights and informed decisions for effective data analysis.
Availability
![]() Users, Editors, and Admins
Users, Editors, and Admins
![]() All accounts
All accounts
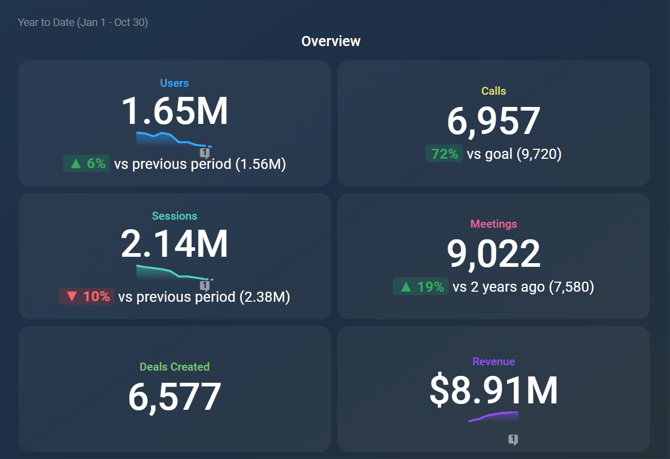
The Number visualization is a concise and effective way to present key metrics in a visually impactful format. It displays a single numerical value, which allows users to quickly assess performance at a glance. The optional small line graph underneath the number provides additional context by illustrating recent trends, making it easier to identify fluctuations and changes over time. This visualization is particularly valuable for tracking critical metrics, enabling teams to make informed decisions based on real-time data.

Features
The following features highlight the key functionalities of the Number visualization:
- A maximum of 15 numerical values can be displayed simultaneously.
- Each number may represent a metric or encompass one or more dimensions associated with a metric.
- Comparisons are set up at the metric level.
- A small chart can be toggled on at both the metric and visualization level.
- The displayed numbers can be sorted based on their value, the name of the metric or dimension, change value, or by manually rearranging the metrics in a custom order.
Use Cases
The Number visualization is ideal for various scenarios, including:
-
Sales Performance Tracking: Monitor total sales figures for different products or regions, helping sales teams quickly identify top performers and areas needing improvement.
-
Website Analytics: Display key metrics such as unique visitors, bounce rates, or conversion rates, allowing marketing teams to assess the effectiveness of their campaigns at a glance.
-
Financial Metrics: Present critical financial indicators like revenue, profit margins, or expenses, enabling stakeholders to gauge the organization's financial health quickly.
-
Customer Support Metrics: Track key performance indicators such as response times, ticket resolution rates, or customer satisfaction scores, allowing support teams to improve service delivery.
-
Project Management: Showcase progress metrics such as tasks completed, deadlines met, or budget usage, helping project managers stay informed and adjust plans as needed.
Still need help?
Visit our community, send us an email, or start a chat in Databox.