
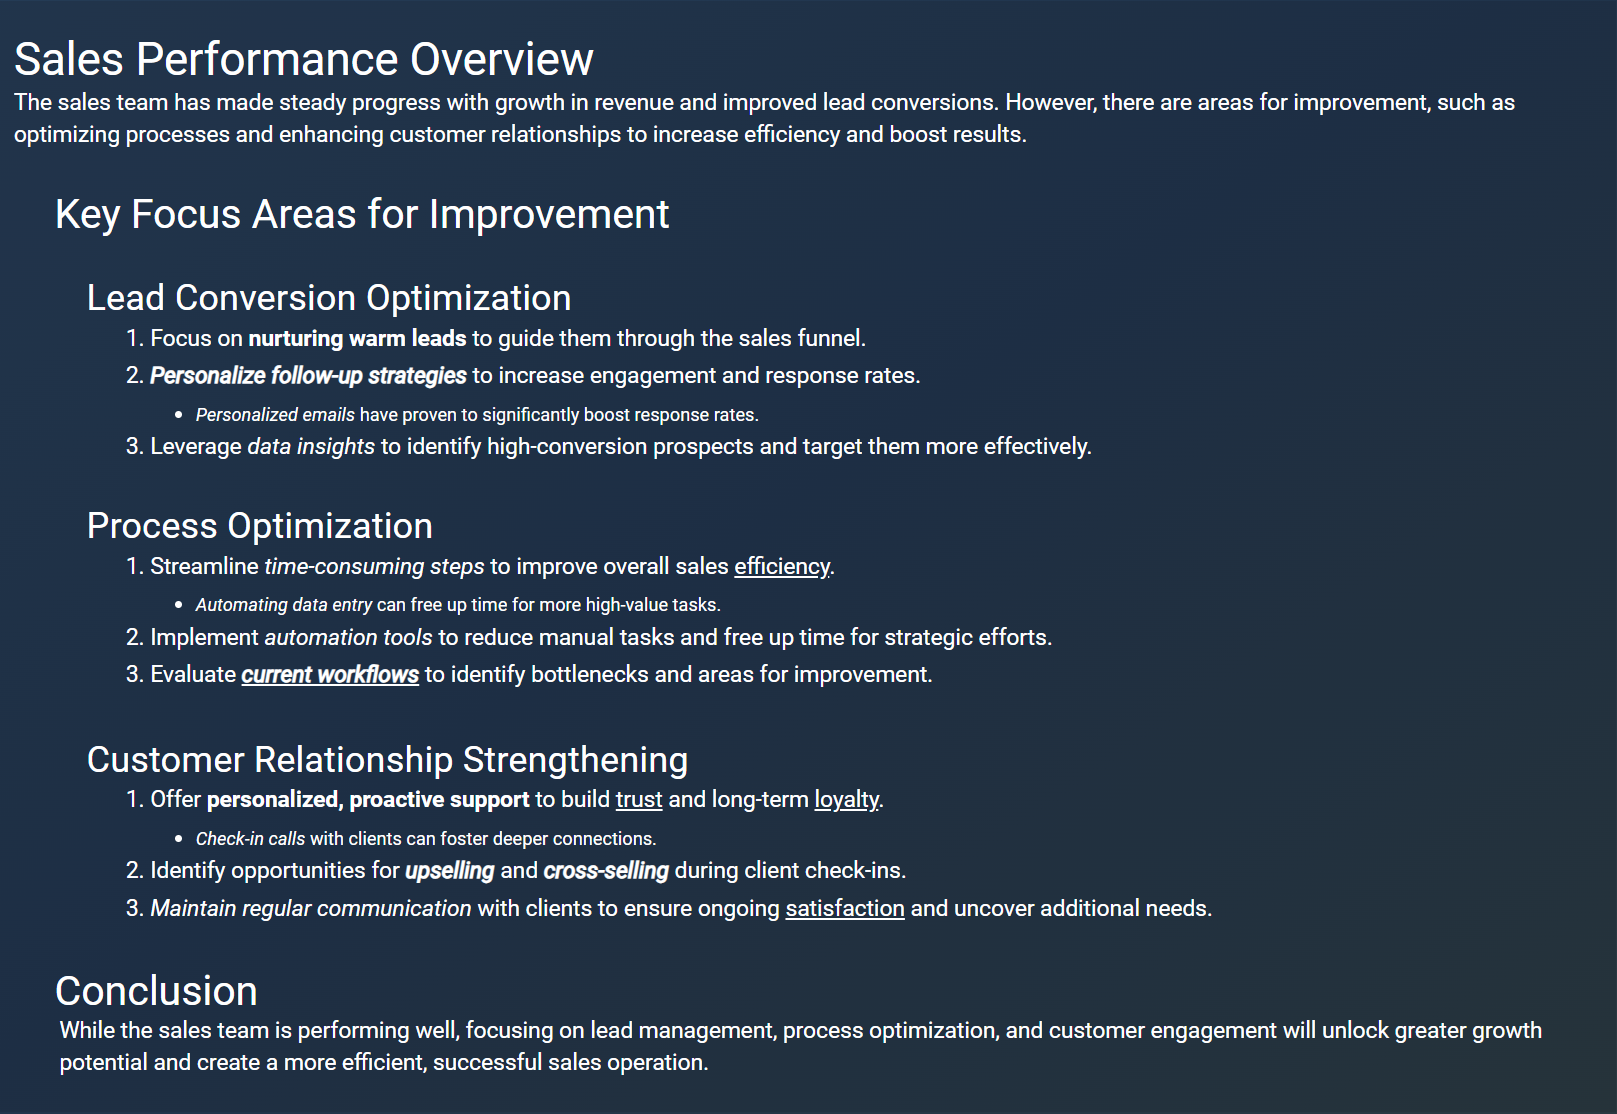
The Notes visualization provides a customizable text field that allows users to add explanatory notes, context, or instructions alongside other visualizations. This feature enhances the overall understanding of the data presented by providing important insights or guidance.
The following features highlight the key functionalities of the Notes visualization:
- Text formatting options include bold, italic, underline, hyperlink, horizontal alignment, bullet points, indentation, and six levels of headings and paragraphs.
- The timestamp of the last text update can be included in the visualization for future reference.
The Notes visualization is particularly useful in various scenarios, including:
- Project Documentation: Adding context to data visualizations for team members to understand the metrics.
- Training Materials: Providing instructions and explanations alongside performance dashboards for new users.
- Executive Summaries: Summarizing key insights and recommendations directly within the dashboard.


