
The Heatmap visualization presents data in a color-coded grid format, allowing users to easily identify patterns, trends, and seasonality over different time periods such as days, weeks, or months. By using color gradients, it effectively highlights variations in metric values or frequencies, making it an invaluable tool for analyzing large datasets at a glance.
The following key functionalities are offered by the Heatmap visualization:
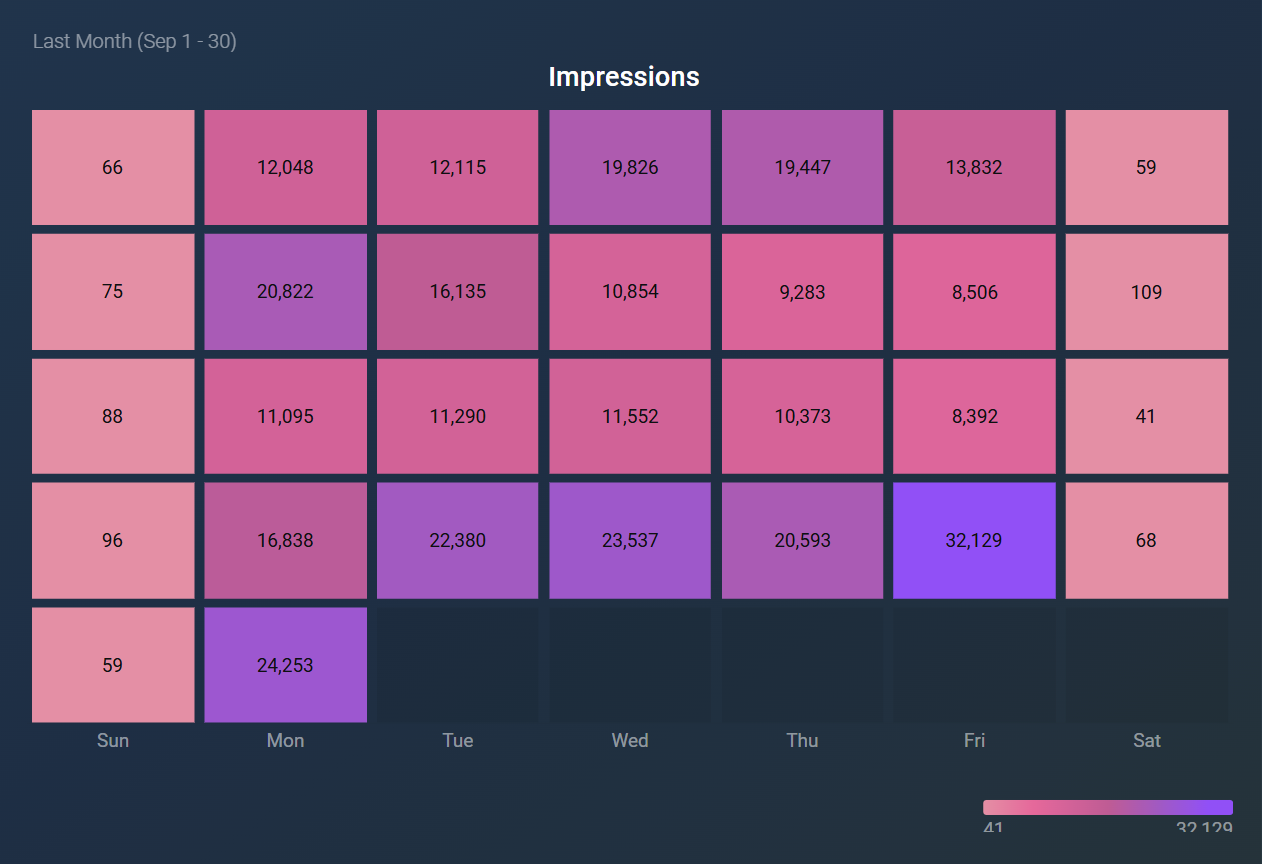
- A dynamic grid is displayed based on the selected granularity.
- Value visibility can be toggled on or off for enhanced clarity.
- The number of tiles per row can be customized to fit layout preferences.
- Annotations can be added to mark key events directly on the chart.
- The color gradient is based on the selected color theme.
- For daily grids, the first column reflects the first day of the selected period.
- Comparison values and percentages are displayed only when hovering over the tiles.
- This visualization displays data for only one metric or dimension at a time.
The Heatmap visualization is particularly useful in various contexts, including:
- Sales Performance Analysis: Identifying sales trends across different time periods, helping teams understand peak sales days or weeks.
- Website Traffic Monitoring: Analyzing user engagement on a website over time to determine which days or times drive the most traffic.
- Customer Support Metrics: Spotting patterns in support ticket volume across different days of the week, aiding in resource allocation.


