
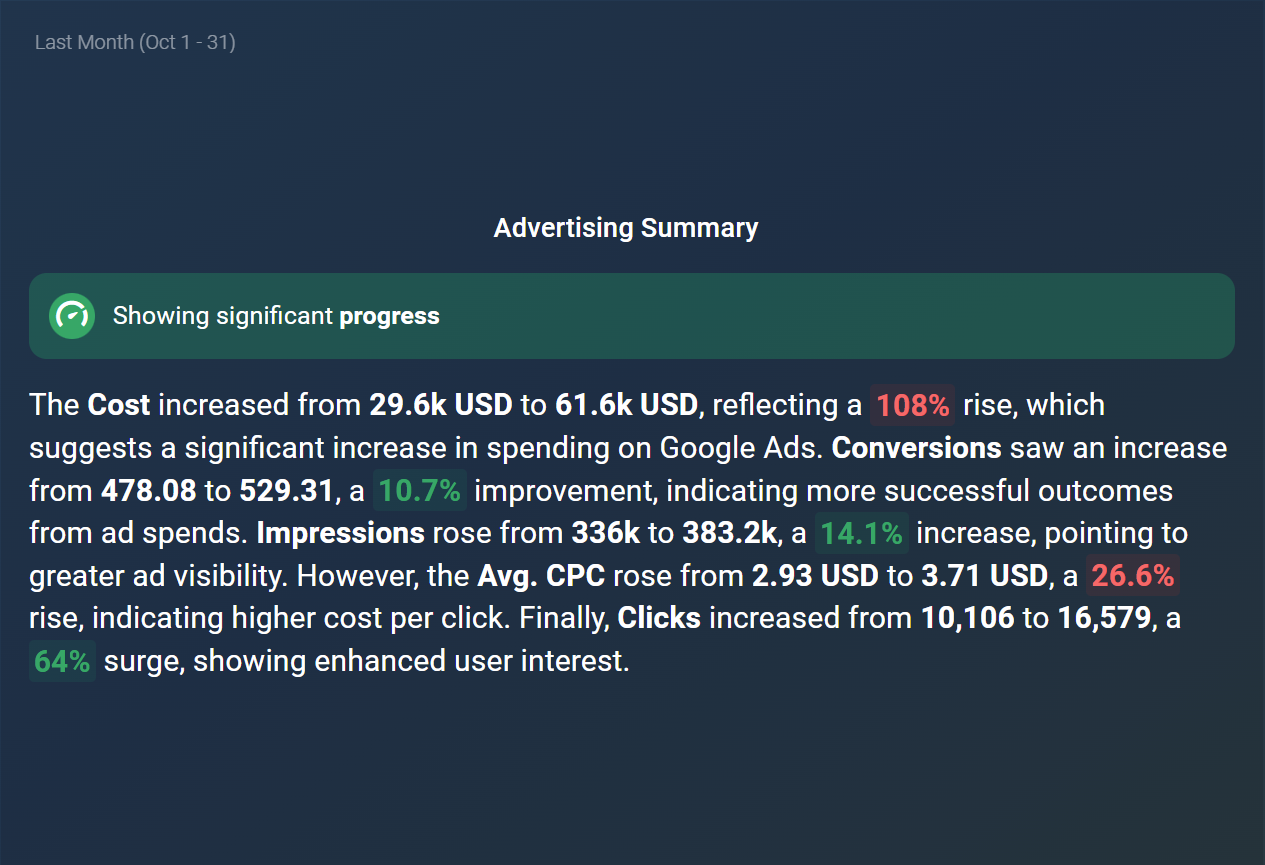
The AI Summary visualization offers automatically generated insights, making data analysis quicker and more accessible by summarizing key metrics' performance at a glance. Ideal for high-level overviews, it provides quick narratives around your metrics' trends, comparisons, and performance indicators.
The following features highlight the key functionalities of the AI Summary visualization:
- Summarizes up to 10 metrics or dimensions at once.
- Metrics can be added quickly via the Add all metrics from this Databoard option.
- Each metric's comparison period is configurable.
- Multi-language support is available.
- Performance indicators can be toggled on or off.
- Summary length and narrative style are adjustable.
- Summaries refresh automatically to incorporate updated data.
- The generated summary text can be edited afterward.
- As summaries are generated using paid third-party language models, regeneration timing differs from standard data syncs and is limited by user/account quotas.
- Summary text is limited to preset options for length and style.
- Once the summary text is edited, automatic regeneration and date range selection will be disabled.
The AI Summary visualization is particularly helpful in scenarios such as:
- Executive Reports: Provide high-level summaries for leadership without overwhelming detail.
- Client Dashboards: Offer clients an easily digestible summary of key metrics.
- Team Meetings: Generate quick insights for discussing current trends and performance.


