Overview: Using AI-powered Performance Summaries for Databoards
Databox’s Generative AI functionality provides you with comprehensive performance summaries along with tailored recommendations on how to improve performance. In this article, we will dig deeper into how you can access and use these performance summaries for Databoards to make efficient data-driven decisions.
Learn more about how Databox’s Generative AI works here.
Databox's Generative AI feature is available on Growth and Premium plans. Request a trial of Databox's Generative AI by following these steps.
IN THIS ARTICLE
- How to access Performance Summaries of Databoards
- How to use Performance Summaries of Databoards
- Additional information
How to access Performance Summaries of Databoards
IN THIS SECTION
- How to access Performance Summaries of Databoards
- How to access Performance Summaries of Databoards in Databoard Preview
- How to access Performance Summaries of Datablocks in Designer
How to access Performance Summaries for Databoards

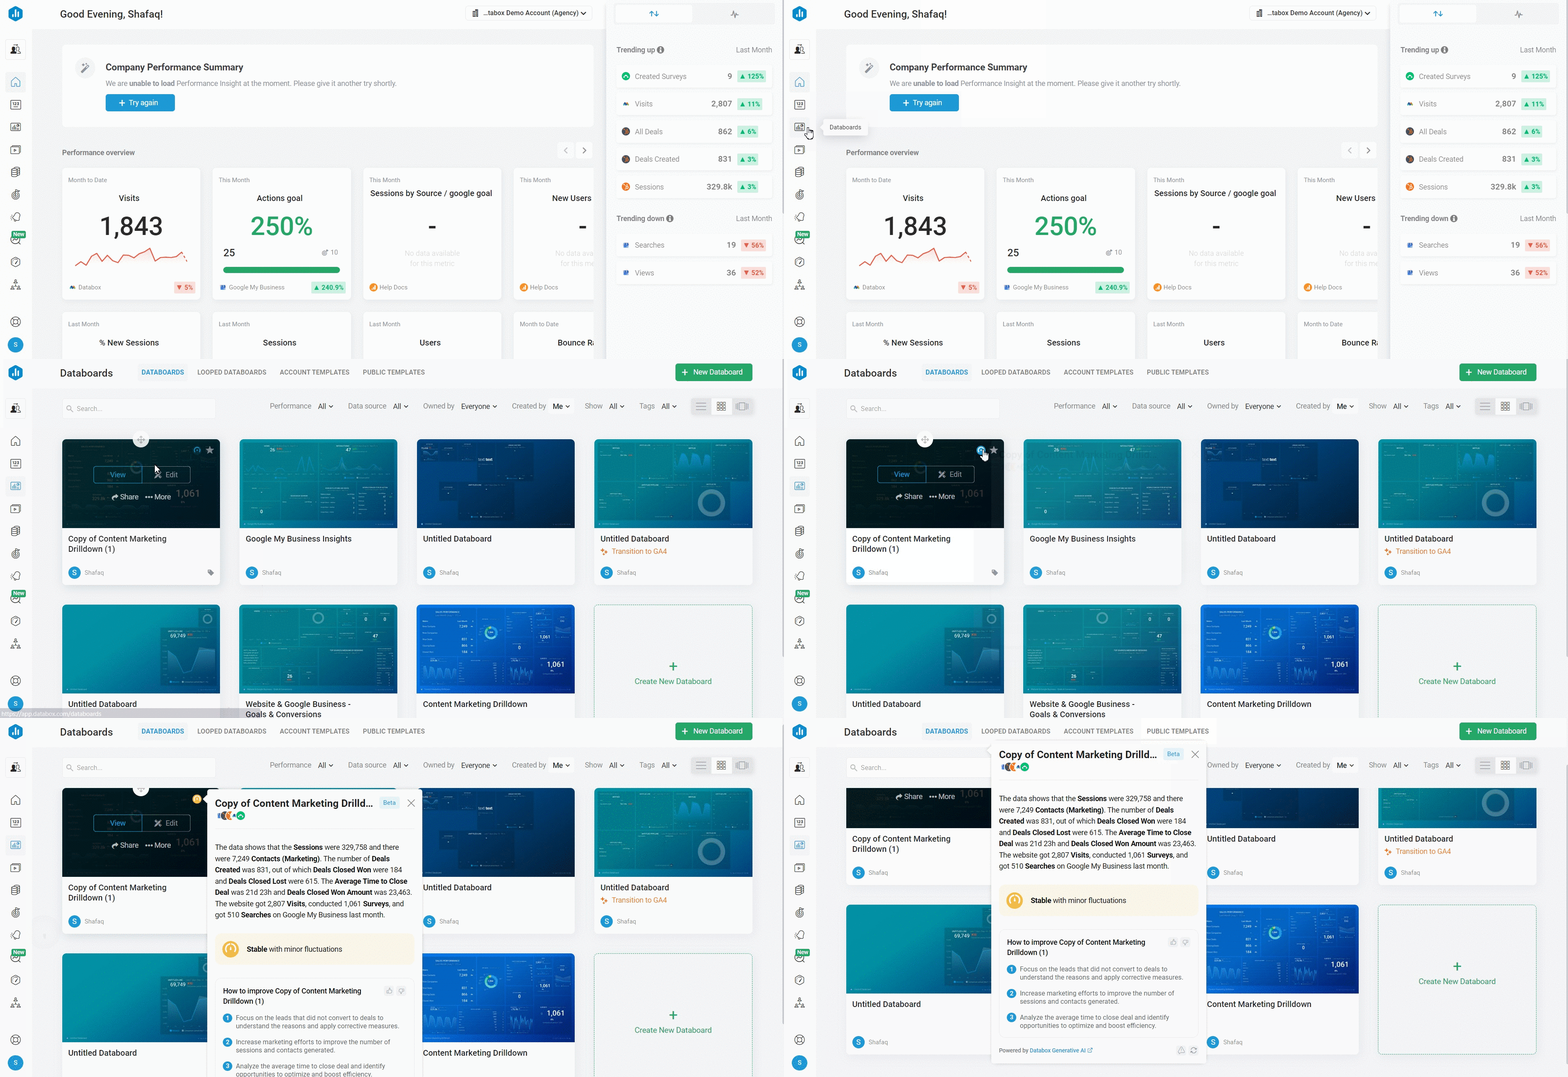
Navigate to the Databoards page. Hover over the Databoard you want to view the Performance Summary of, and click the Performance Indicator. This will open the Performance Summary of that specific Databoard.
How to access Performance Summaries for Databoards in Databoard Preview

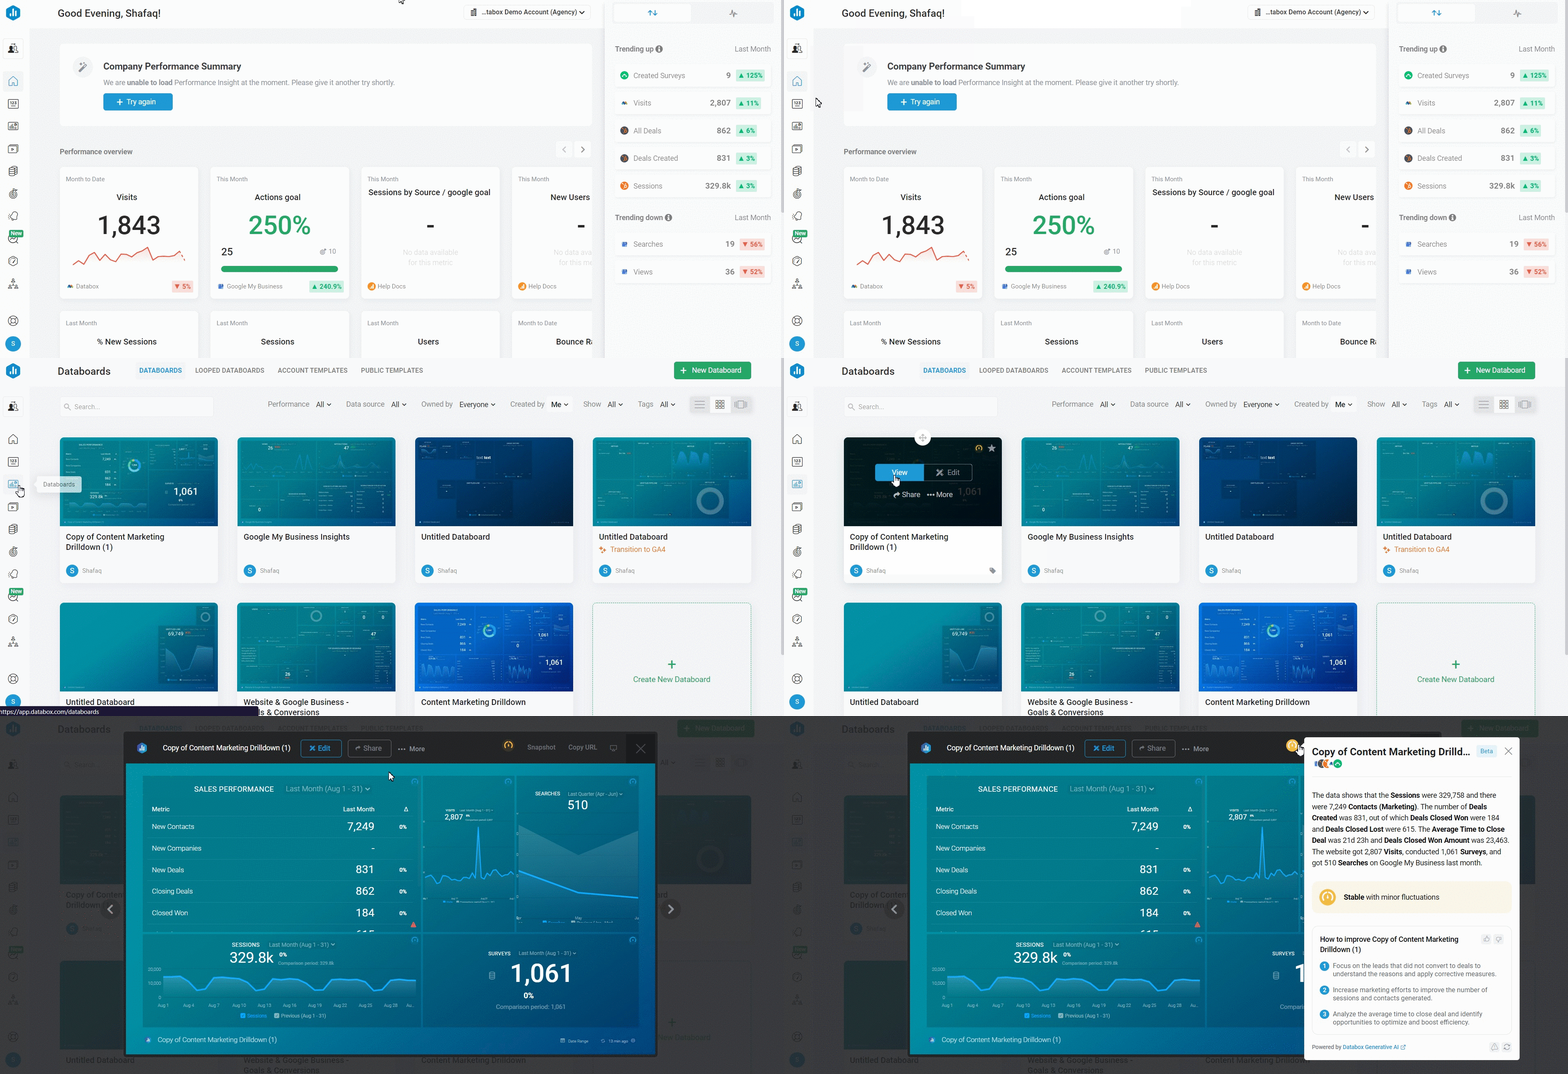
Navigate to the Databoards page. Hover over the Databoard and click the view button. Click on the Performance Indicator icon in the top right corner, this will open the Performance Summary of that specific Databoard.
How to access Performance Summaries of Datablocks in Designer

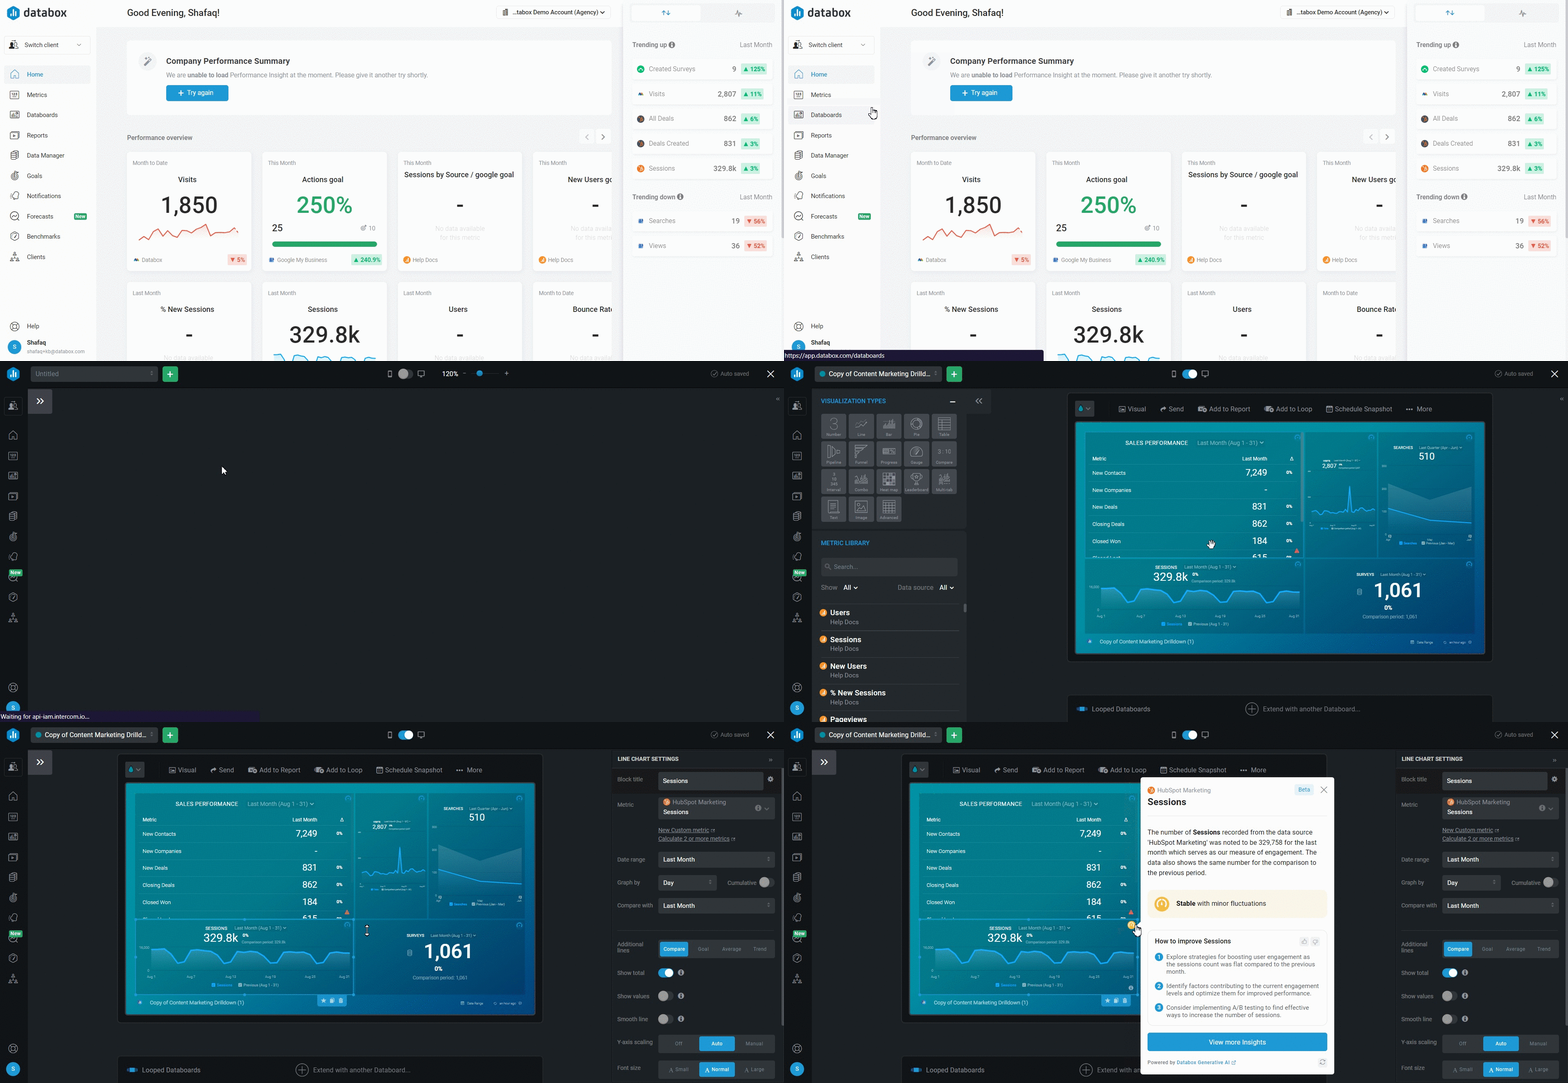
Navigate to the Databoards page. Hover over the Databoard that you want to edit and click Edit. This will open the Databoard in the Designer. Click on the Performance Indicator icon in the top right corner of the Datablock. This will open the Performance Summary for that specific Datablock.
How to use Performance Summaries of Databoards

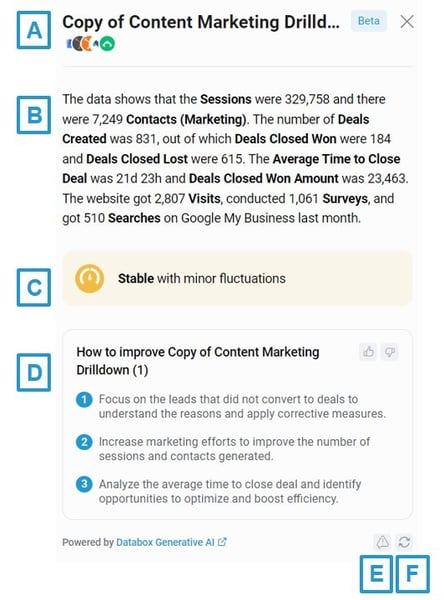
- A) Databoard Name and Data Sources: This shows the name of your Databoard and logos of the Data Sources.
- B) Data Summary: Data summary offers a concise performance overview of the Databoard. The Data summary includes current data for the date range that is chosen for your top 5 Metrics.
- C) Performance Indicator: The Performance Indicator will change colors depending on your performance:
-
Green indicator: Significant progress and success.
5% or higher positive percentage change in comparison to previous period
-
Orange Indicator: Stable with minor fluctuations.
Percentage change between 4% negative and 4% positive in comparison to previous period
- Red Indicator: Performance decline, corrective action needed.
5% or higher negative percentage change in comparison to previous period - Blue Indicator: Performance evaluation unavailable.
There is not enough data in the previous period to compare or there is an error with data.
-
- D) Recommendations: You will get three general suggestions on how to improve the performance of the Metrics on your Databoard
- E) Disclaimer: The Disclaimer icon will appear if there might be a data discrepency in the Performance Summary due to different time zones. To resolve this and get the latest data, you should click on the Reload icon to reload the Performance Summary.
- F) Reload: Click on the Reload icon to reload the Performance Summary.
Additional Information
Performance Summaries have daily and monthly limits based on your account type.
- Standard accounts
- 3,000 summaries per account per month
- 800 summaries per account per day
- 100 summaries per user per day
- Agency accounts
- 6,000 summaries per account per month
- 800 summaries per account per day
- 100 summaries per user per day
If you’ve reached your daily or monthly limit for AI-powered Performance Summaries, you’ll need to wait until the next day or month to generate more.
The daily limit restarts at 12 AM (UTC time zone). For example, if you hit the daily limit at 7 PM, you can try again after midnight (UTC time zone) when the date changes. For further assistance, please contact our Support Team via chat.
Still need help?
Contact us here or start a chat in Databox.