Overview: Metrics
The Metrics screen allows you to monitor all of the Metrics important to you in one screen and invite your teammates to do the same, so that can get aligned around the metrics that matter to your organization.
The Metrics screen and Metrics Library are commonly used to verify what metrics you can pull and visualize using Databox, continuously monitor your top Metrics in one screen at any time, pick metrics to use for goals, setup alerts for metrics and build Databoards you can share with stakeholders.
Pro Tip: For additional information about the value of Metrics in your business, learn more here.
HOW TO
- Access the Metrics screen
- Use the Metrics screen
- Access the Metric Insights Page
- Use the Metric Insights Page
- Access the Metrics Library
- Use the Metrics Library
How to access the Metrics screen
The Metrics screen is a central location where you can align your team around the Metrics that matter, monitor your performance, set Goals, and more.

Navigate to Metrics to access the Metrics screen.
How to use the Metrics screen
HOW TO
- Use the Metrics screen
- Add Metrics to the Metrics screen
- Invite Colleagues to Add Metrics
- Change the Date Range
- Troubleshoot why "No Data is Available" for a Metric
- Tag Metrics to organize yourself and your team
- Favorite your Metrics
- Reorder your Metrics
- Filter the Metrics screen to show a subset of your Metrics
- Remove Metrics from the Metrics screen
- Add Metrics to a Databoard from the Metrics screen
- Set a Goal from the Metrics screen
- Set an Alert from the Metrics screen
How to use the Metrics screen
The Metrics screen allows you and your colleagues to add any Metric to an infinitely scrolling list of Metrics and organize them using Tags.
Once you add your Metrics, you can quickly scan the screen to see which metrics have increased or decreased by looking for a green or red line at the bottom of each Metric block or the green or red arrow right below the metric.
The Metrics screen also shows the Metric value and a blue sparkline to represent daily fluctuation.
The Metrics screen shows all Metrics that were added by you at the top, and all Metrics that were added by other users in your Account at the bottom.
All Metrics that you have added to your My Metrics screen will be accessible in the Designer. To view these Metrics, navigate to the Metric Library section in the Designer. Click on the Show dropdown arrow and select Favorite.
How to add Metrics to the Metrics screen
IN THIS SECTION
- How to manually add Metrics to the Metrics screen
- What Metrics are automatically added to the Metrics screen?
How to manually add Metrics to the Metrics screen

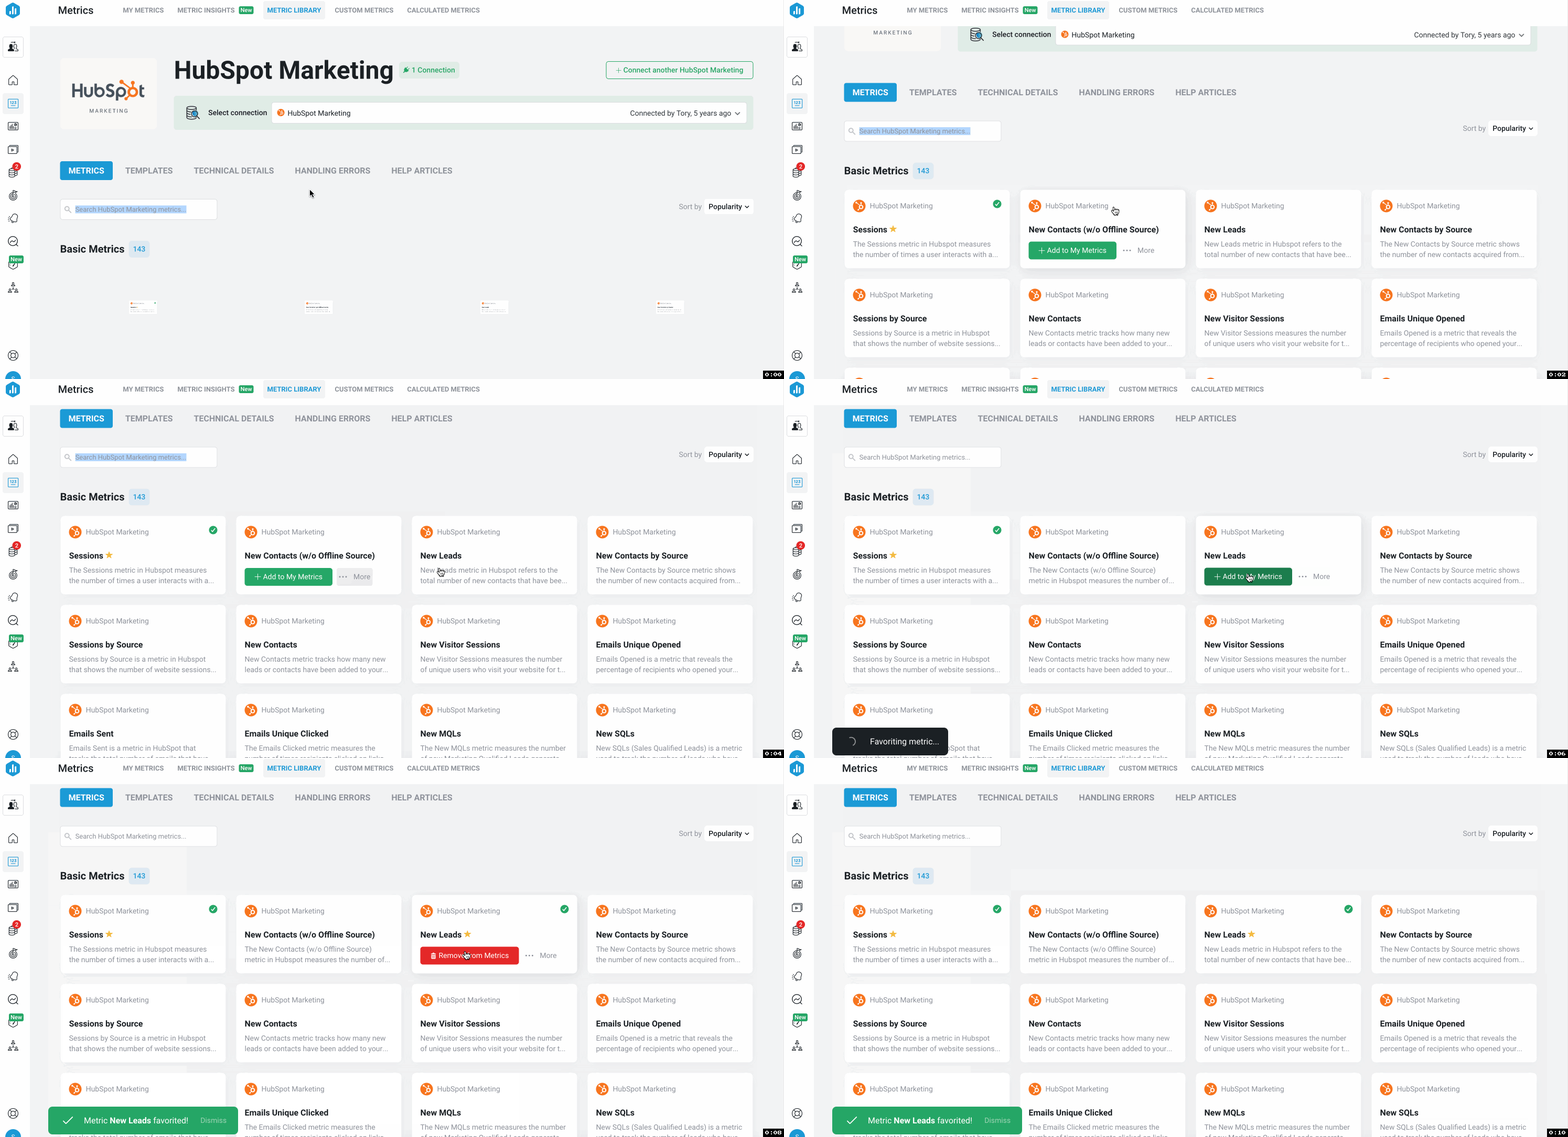
Navigate to Metrics> Metrics Library where you have full visibility into the Metrics that are available in Databox via our native integrations.
Using the Search bar, you can search for a specific Metric or keyword, like “Sessions.” This will show you all of the “Sessions” Metrics that are available in Databox.
You can also go scroll to the Popular Integrations section to narrow your focus and only view Metrics for a specific Data Source.
Hover over the logo in the top right of each Metric block to view more information on the Metric itself. Add the Metrics that are significant to you to your Metrics screen by clicking Add to my Metrics.

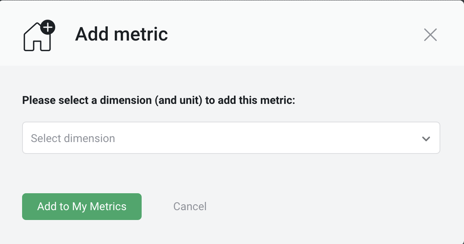
When adding Dimensional Metrics to your Metrics screen, you will be prompted to select the Dimension that you would like to add. Learn more about Dimensional Metrics here.
What Metrics are automatically added to the Metrics screen?
Whenever you create a Goal, Alert, or Favorite a Metric, the Metric will be added to your Metrics screen.
Metrics that are used on Databoards and Scorecards in your Account are not automatically added to your Metrics screen.
Invite Colleagues to Add Metrics
To invite colleagues to select Metrics, they must be added as a user in your Account. Learn how to add users to your Account here.
Pro Tip: It's recommended that you encourage team members to add Metrics to the Metrics screen before building performance dashboards. This allows each individual in your organization to select the Metrics that are important to them.
How to change the Date Range
You have the ability to change the Date Range for a single Metric or for all Metrics on the Metrics screen.

To change the Date Range for a single Metric, click the drop-down arrow next to the Date Range on the Metric block. This will open the Date Range drop-down list.
Select the Date Range that you'd like to view the Metric for.

To change the Date Range for all Metrics, click on the Date Range drop-down in the top right of the Metrics screen. Select the Date Range that you'd like to view all Metrics on the Metrics screen for.
Learn more about Date Ranges here.
How to troubleshoot why "No Data is Available" for a Metric
You may see a message saying "No data available for this metric."

This message signals that Databox does not have data for the selected Date Range. If the Metric is built using Metric Builder, try editing the Custom Metric to include the Date Range you’d like to view.
How to Tag Metrics to organize yourself and your team
From the Metrics screen, you have the ability to Tag single Metrics or groups of Metrics. You can filter by Tag at the top of the Metrics screen to view a specific group of Metrics.

To Tag a single Metric, click the Tag icon in the bottom right of the Metric block. Click + Create new to create a new Tag or Manage tags to edit any existing Tags.
Select the appropriate checkbox(es) to add Tags to the Metric.

To Tag multiple Metrics, click the checkbox in the top left of the block to select the Metric. Do this for any Metric you would like to Tag. This will expose a blue Add to Databoard button in the top right of the screen.
Click the arrow next to the Add to Databoard button. From the drop-down list, select Add Tags. This will expose the Tags list so you can Tag the selected Metrics.
Click Apply to apply the Tags to the selected Metrics.
Learn more about Tags here.
How to Favorite Metrics
From the Metrics screen, you have the ability to Favorite a single Metric or groups of Metrics.
Pro Tip: You can view your Favorite Metrics on your My Metrics page. To filter your favorite Metrics navigate to the Show filter > Favorites.
To Favorite a single Metric, click the star icon in the top right of the block.

To Favorite multiple Metrics, click the checkbox in the top left of the block to select the Metric. Do this for any Metric you would like to Favorite. This will expose a blue Add to Databoard button in the top right of the screen.
Click the arrow next to the Add to Databoard button. From the drop-down list, select Add to Favorites.
How to reorder your Metrics

You can rearrange Metrics on the Metrics screen by dragging and dropping the Metric block. This allows you to create the optimal view for you to quickly and efficiently monitor your key Metrics.
How to filter the Metrics screen to show a subset of your Metrics

Use the Show drop-down to filter the Metrics screen to show all Metrics, Metrics you added, Metrics added by other users in your Account, or your Favorite Metrics.

The Metrics screen can also be filtered based on Tag. Because of this, Tags should be used to organize your Metrics and create the views you need.

In order to view Metrics for a specific Data Source, use the Data Source drop-down.
How to remove Metrics from the Metrics screen

To remove a Metric from the Metrics screen, click the ... icon in the top right of the block to open the Metric drop-down list. Select Remove.
You will only be able to remove Metrics that you added to the Metrics screen. You will not be able to remove Metrics that other users in your Account added to the Metrics screen.
How to add Metrics to a Databoard from the Metrics screen
From the Metrics screen, you can add a single Metric or multiple Metrics to a Databoard.

To add a single Metric to a Databoard, click the ... icon in the top right of the block to open the Metric drop-down list. Select Add to Databoard.
This will open the Add Datablock window. From here, you will be prompted to select the Databoard where you would like to add the Datablock. You can also specify how you'd like to visualize the Metric at the bottom of the window. Click Add to Databoard to complete the process.

To add multiple Metrics to a Databoard, click the checkbox in the top left of the block to select the Metric. Do this for any Metric you would like to add to the Databoard. This will expose a blue Add to Databoard button in the top right of the screen.
Click the Add to Databoard button and select the Databoard where you would like to add the Datablocks. Click Select Databoard to complete the process.
How to set a Goal from the Metrics screen

To set a Goal, click the ... icon in the top right of the block to open the Metric drop-down list. Select Set Goal.
This will open the Goal Setup window. From here, you can set a Goal for the selected Metric.
Learn more about Goals here.
How to set an Alert from the Metrics screen

To set an Alert, click the ... icon in the top right of the block to open the Metric drop-down list. Select Set Alert.
This will take you to the Alerts page where you can set an Alert for the selected Metric.
Learn more about Alerts here.
How to access the Metric Insights Page
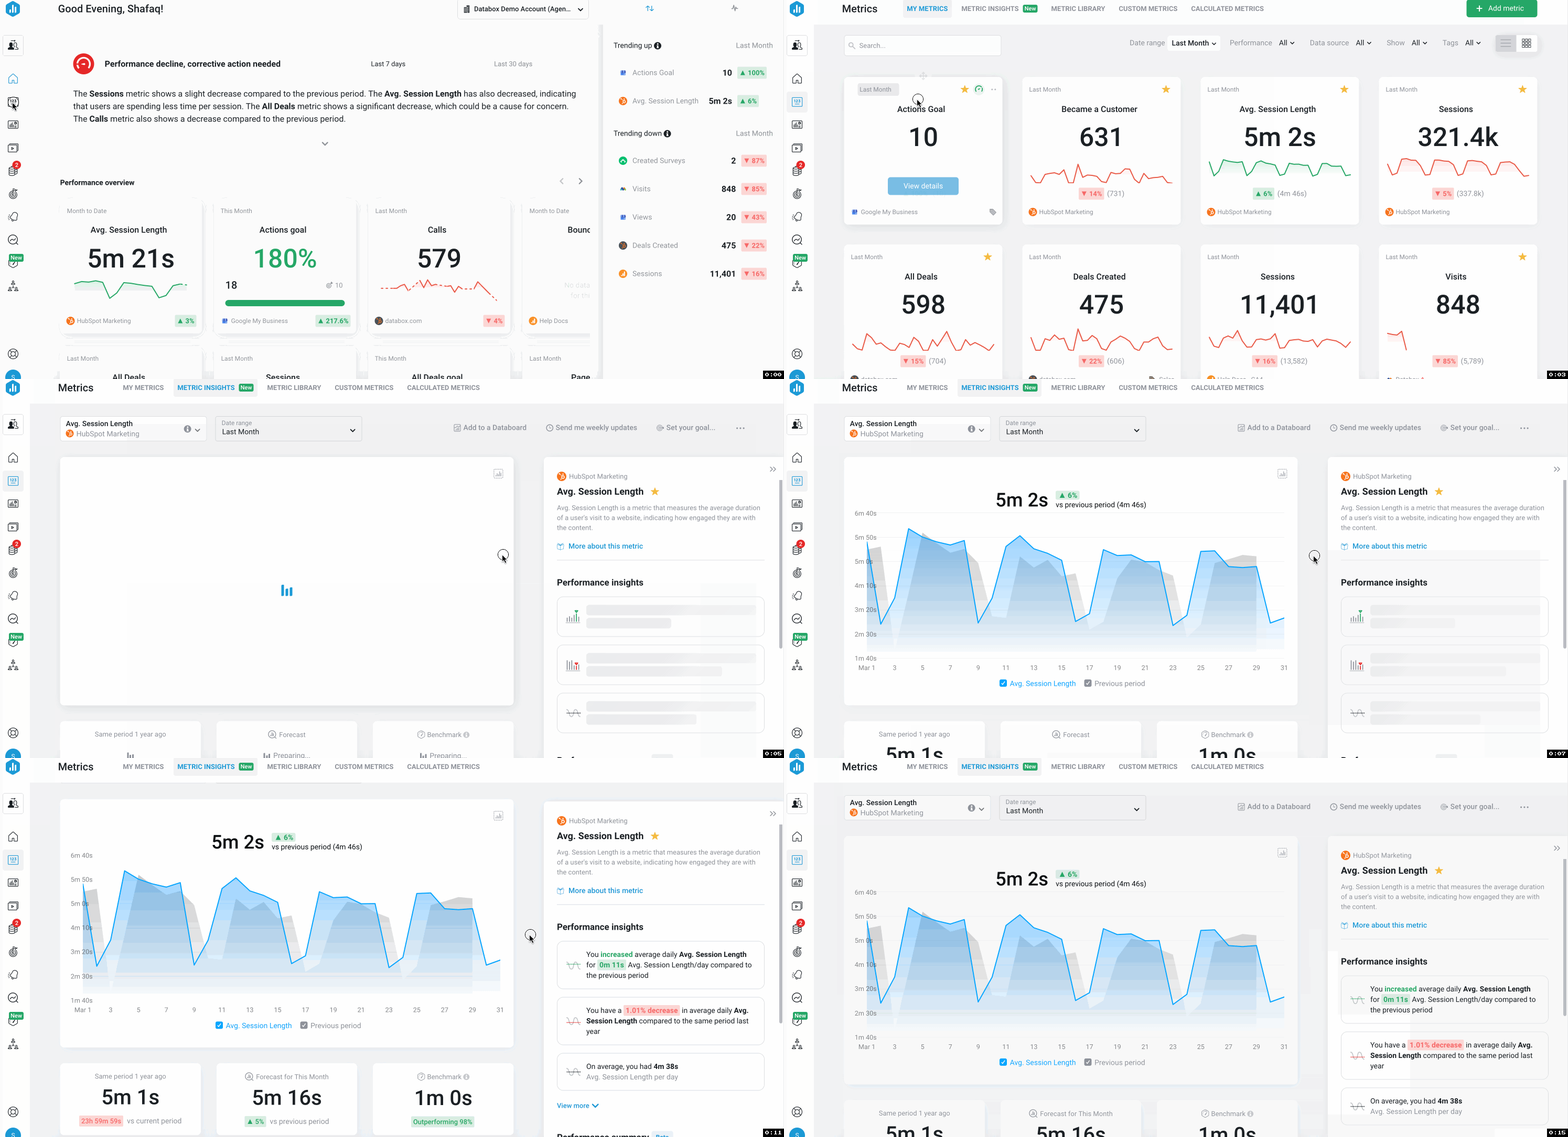
With Metric Insights, you can now access all the information about a specific metric from one screen . You can use it to monitor your performance, track emerging trends or patterns in your data, set more realistic goals for core KPIs, and ultimately achieve better results.

Navigate to Metrics to access the Metrics screen. Hover over the Metric you want to view the insights of and click the blue View details button. This will open the Metric Insights Page for the selected Metric.
You can also access the Metric Insights page directly by navigating to Metrics and clicking on Metric Insights from the navigation bar at the top.
How to use the Metric Insights Page
Learn how to use the Metric Insights Page here.How to access the Metrics Library
The Metrics Library gives full visibility into the Metrics that are available in Databox's native integrations, as well as any custom metric you create with Metric Builder or Calculated metric you create with Data Calculations.

Navigate to Metrics > Metrics Library to access the Metrics Library. Use the Search bar to search for a Metric, or select the Data Source whose Metrics you want to view from the Data Source drop-down list.
How to use the Metrics Library
Learn how to use the Metric Library here.