
Basic metrics may not always provide the specific insights you need to track your business performance effectively. In Databox, custom metrics allow you to tailor your reporting to better reflect how your business defines success.
Instead of relying solely on predefined metrics from a data source, you can define your own logic, refine existing data, or combine multiple metrics to match your specific reporting needs and measure performance in a way that aligns with your goals.
To get started:
Navigate to Metrics > Custom Metrics.
Click + Custom metric.
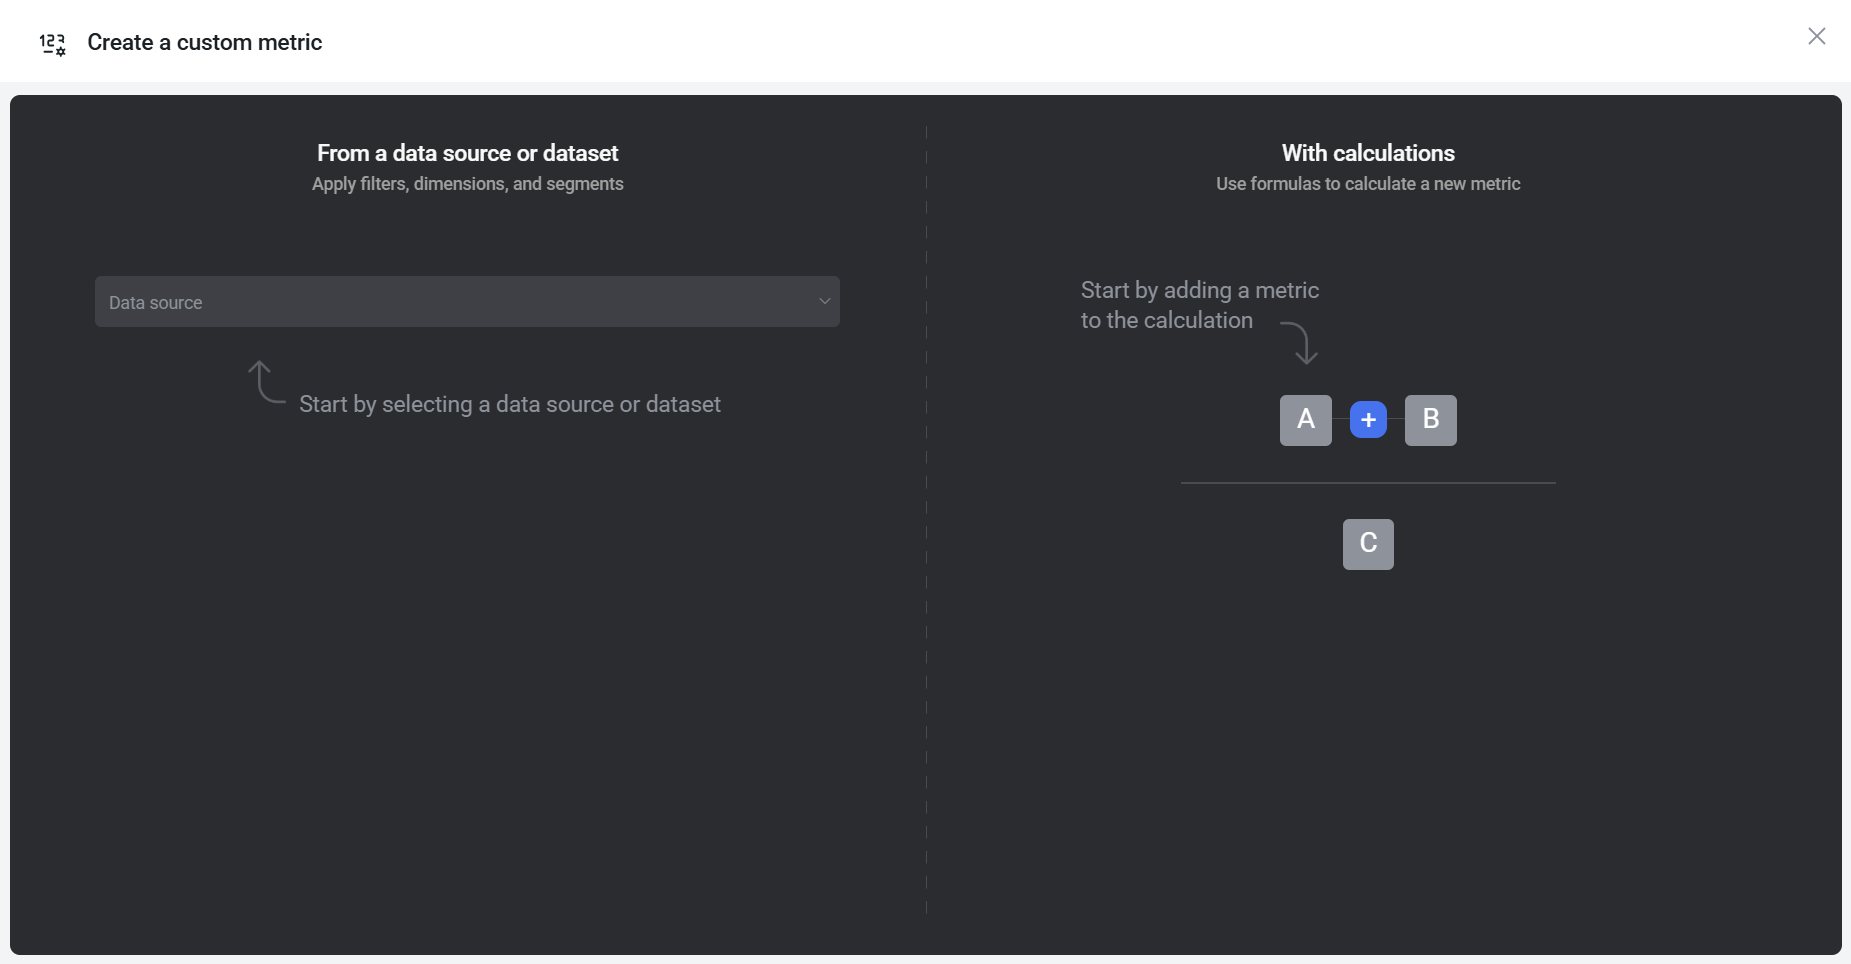
In the Create a custom metric dialog, choose how you want to build your metric:
- From a data source or dataset – Select a data source and configure the metric using dimensions, filters, and aggregation options.
- With calculations – Combine metrics and/or fixed values into a formula to create a derived metric.
Use this option to create a custom metric by selecting a data source or dataset and configuring it in the metric builder using dimensions, filters, and aggregation options.
- Select a data source (or dataset) in the dialog to enter the Metric Builder flow.
- Configure your metric in the metric builder. Available setup options vary depending on the selected source, as the builder adapts its workflow based on the data's origin. The available variants are:
- Datasets
- Spreadsheets
- Predefined API endpoints
- Custom API endpoints
The table below outlines the layout and available options for each metric builder variant:
| Variant | Selectors | Filtering support | Additional options |
|---|---|---|---|
| Datasets | Measure, Date, Dimension | ✅ Yes | Aggregation function |
| Spreadsheets | Value, Date, Dimension | ❌ No | Aggregation function, Edit metric definition |
| Predefined API endpoints | Varies by API | Varies by API | Favorable trend |
| Custom API endpoints | Query parameters, Headers, Pagination method, JSONata expression | ✅ Yes (via JSONata) | Edit metric definition |
Regardless of the data source, you'll need to preview the data before saving the custom metric. This ensures the selected configuration is valid and produces accurate results.
The preview includes a limited number of rows, capped at:
- 200 rows for datasets
- 500 rows for spreadsheets
- 20 rows for API endpoints
The Aggregation function selector determines how individual row values in the selected measure column are combined into a single metric value. Available options depend on the data type of the column:
| Aggregation | Number | Datetime | Text |
|---|---|---|---|
| AVG | ✅ | — | — |
| COUNT | ✅ | ✅ | ✅ |
| LATEST | ✅ | ✅ | — |
| MAX | ✅ | ✅ | — |
| MEDIAN | ✅ | — | — |
| MIN | ✅ | ✅ | — |
| SUM | ✅ | — | — |
| UNIQUE COUNT | ✅ | ✅ | ✅ |
- AVG — Returns the arithmetic mean of all values in the selected date range.
- COUNT — Counts the number of non-null rows.
- LATEST — Returns the value from the most recent row, based on the order by column.
- MAX — Returns the highest value. For datetime columns, this is the most recent timestamp.
- MEDIAN — Returns the middle value when all numeric values are sorted in ascending order.
- MIN — Returns the lowest value. For datetime columns, this is the earliest timestamp.
- SUM — Adds up all values in the selected date range.
- UNIQUE COUNT — Counts distinct values only, equivalent to
COUNT DISTINCTin SQL.
While previewing data in the metric builder, you can rename or exclude individual dimension values directly from the Data Preview. Click Customize next to the dimension column header to access these options.
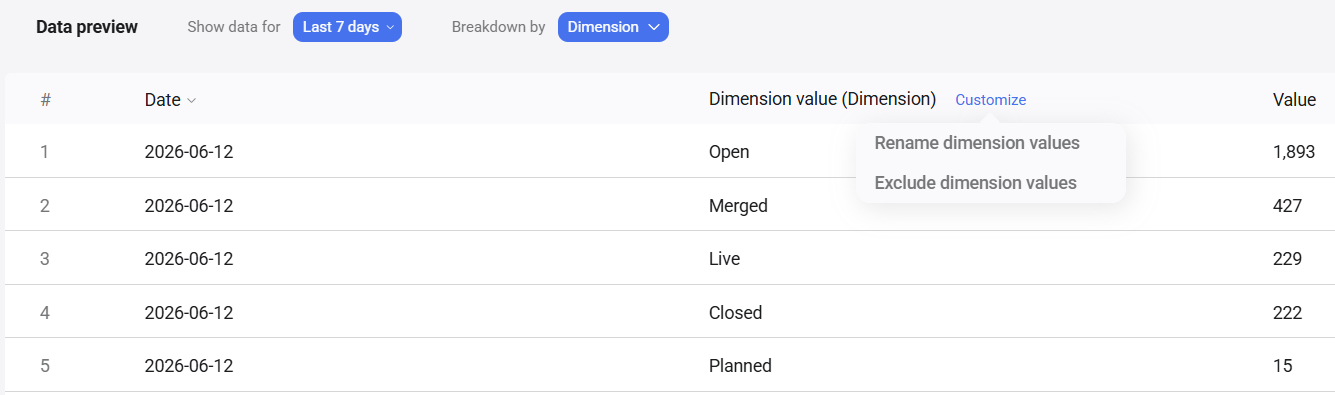
Rename a dimension value
- Click Customize > Rename dimension values.
- Select a dimension value from the dropdown.
- Enter a new name in the Enter new name field.
- Click Save.
Exclude a dimension value
- Click Customize > Exclude dimension values.
- Select the dimension value you want to exclude.
- Click Save.
Excluded values no longer appear as a dimension on Databoards. Renamed values are updated across all instances where that dimension is returned.
Use this option to create a new metric by combining multiple metrics and/or fixed values into a formula. This opens the formula editor, where you build an equation using metric operands (A, B, C, etc.) and operators.
To create a calculated metric:
- Click operand A and select the first data source or dataset and metric you want to use.
- Alternatively, choose Set a fixed value to enter a static number.
- Use the + operator to add an operation (add, subtract, multiply, divide).
- Use parentheses to control the order of operations when needed.
- Click operand B (and additional operands as needed) to complete the equation.
- Review the preview to confirm the calculation returns the expected results.
- Set the Format and Timezone.
- (Optional) Click Edit metric settings to:
- Add a description
- Configure the favorable trend
- Adjust comparison functions
- Enter a descriptive Name for the metric.
- Click Save.
FAQ
Can I use different date ranges for individual metric operands?
Yes. Each metric operand can have its own date range.
To set this up, click the operand, open Advanced Settings, and choose the desired date range. Then enable Retain metric settings for all date ranges to ensure the selected range is always applied, regardless of the date range selected in the visualization.
Keep in mind that relative date ranges (for example, “Last 30 days”) will continue to update dynamically based on the current date.
How does time zone work for custom metrics?
Each data source and dataset in Databox has its own time zone setting. When you build a custom metric using metrics from multiple data sources or datasets, those inputs may not share the same time zone.
To ensure the calculation aligns values to the same dates and time periods, Databox requires you to choose a Timezone for the calculated metric. The selected time zone is used to interpret and aggregate time-based data consistently across all operands in the formula.


