Staying on top of key metrics typically means logging into Databox, navigating to the right Databoard, and remembering to check often enough to catch problems early — none of which happens reliably when everyone is busy. Metric notifications bring the data to you instead. Whether you want a single metric delivered every Monday morning, a multi-metric scorecard landing in your inbox each day, or an immediate alert the moment a number crosses a threshold or behaves anomalously, you can configure exactly what gets sent, when, and to whom.
- Click your name in the bottom-left corner and select Notifications, or navigate to Settings > Notifications.
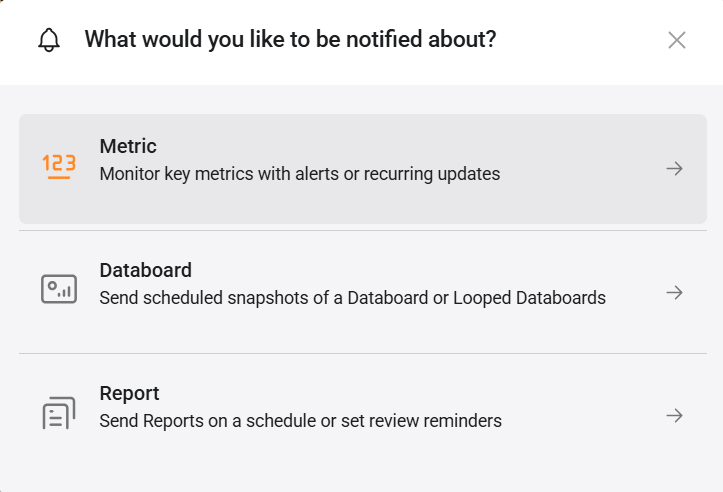
- Click + New notification.
- Select Metric.
- Search for or select the metric you want to monitor from the list.
- Choose a notification type from the tabs at the top of the configuration panel and configure the settings described below.
- Click Save.
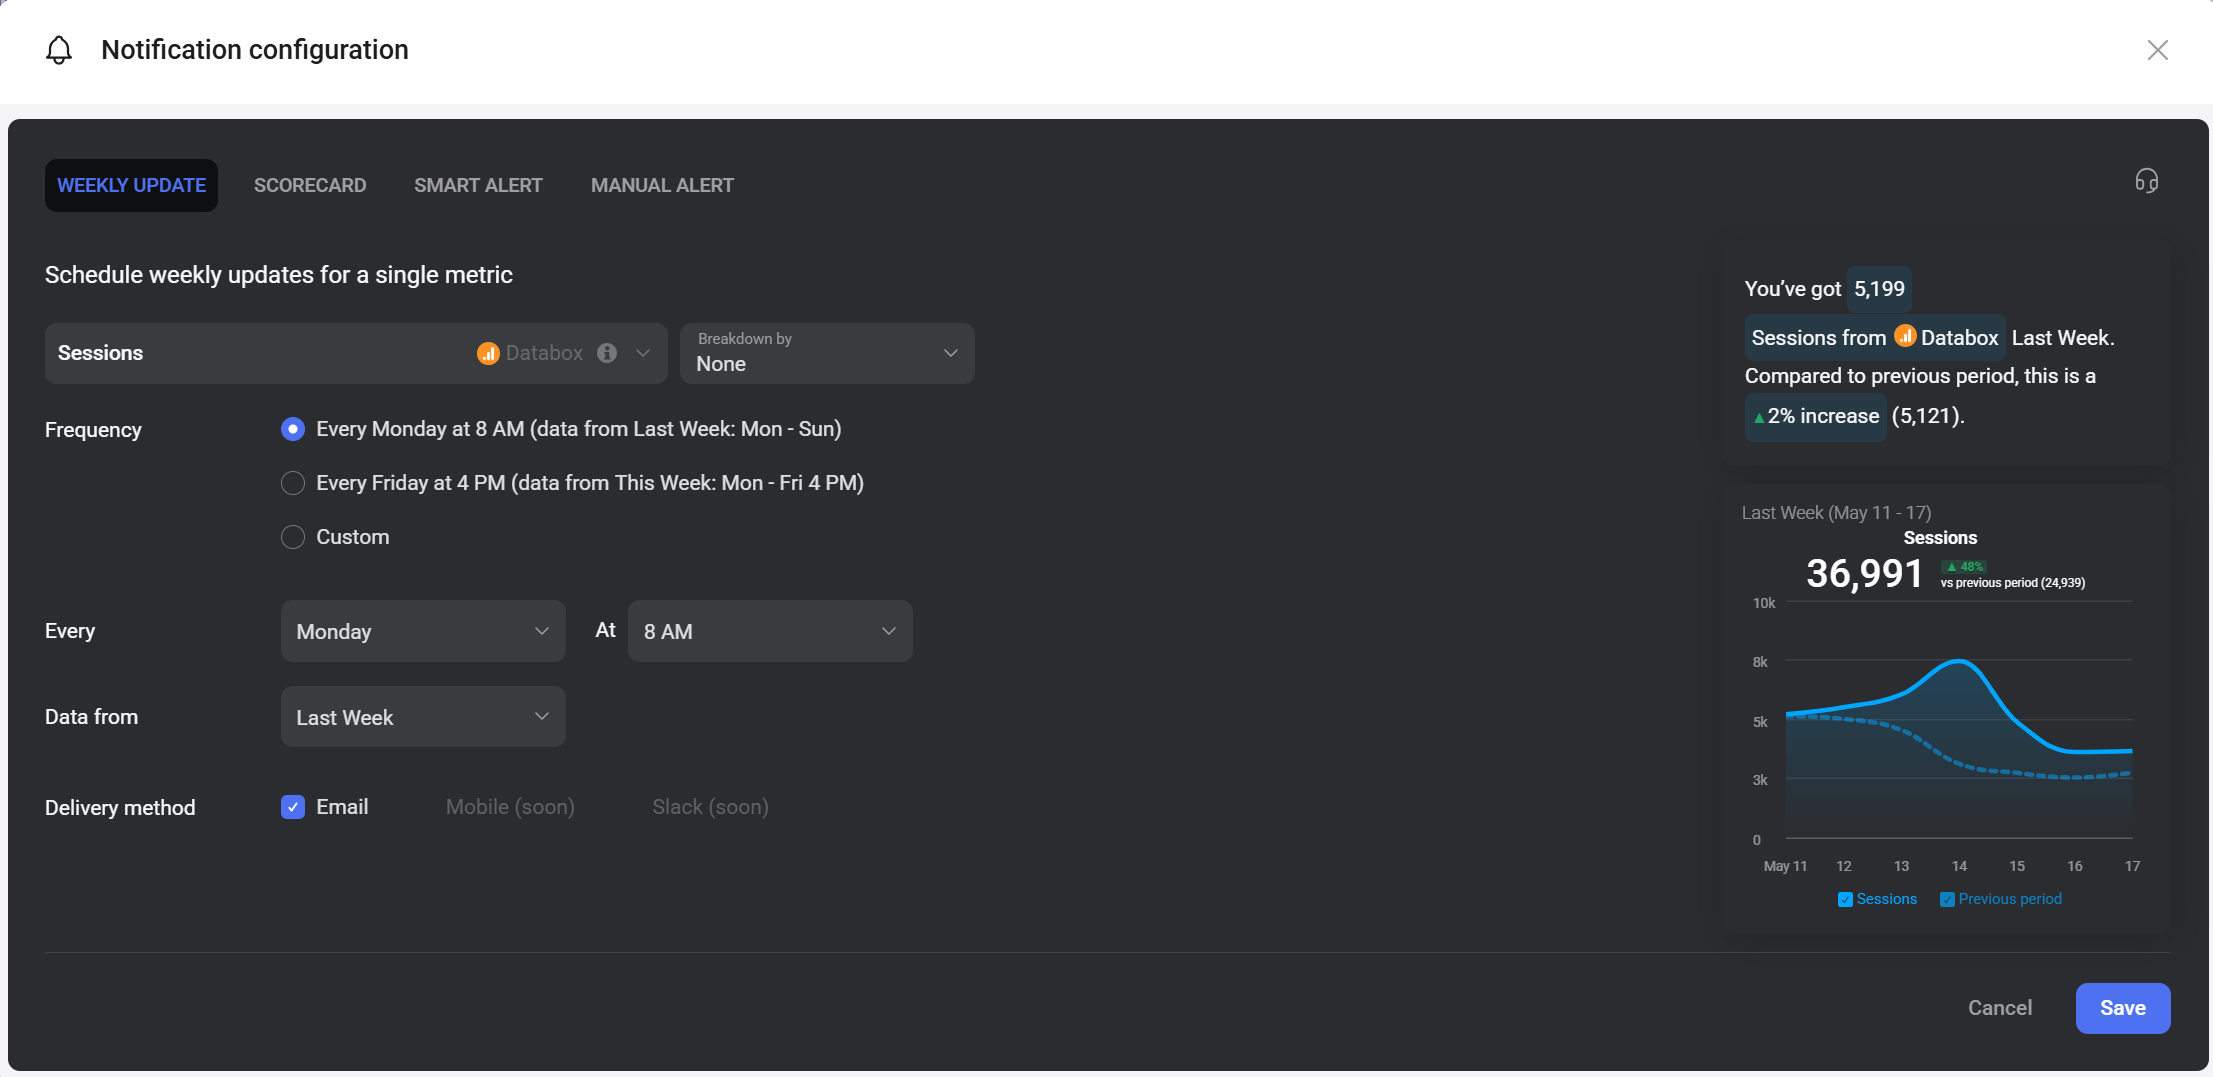
A weekly update sends a scheduled notification for a single metric on a recurring basis.
- Metric: The metric selected in the previous step. Use the Unit dropdown to change the unit displayed.
- Frequency: Choose a preset schedule or select Custom to configure your own.
- Every Monday at 8 AM — delivers data from Last Week (Mon–Sun).
- Every Friday at 4 PM — delivers data from This Week (Mon–Fri 4 PM).
- Custom — set any day, time, and data range.
- Every / At: When Custom is selected, choose the day of the week and delivery time.
- Data from: The date range the metric value is based on when delivered.
- Delivery method: Select Email to receive the update. Mobile and Slack delivery are coming soon.
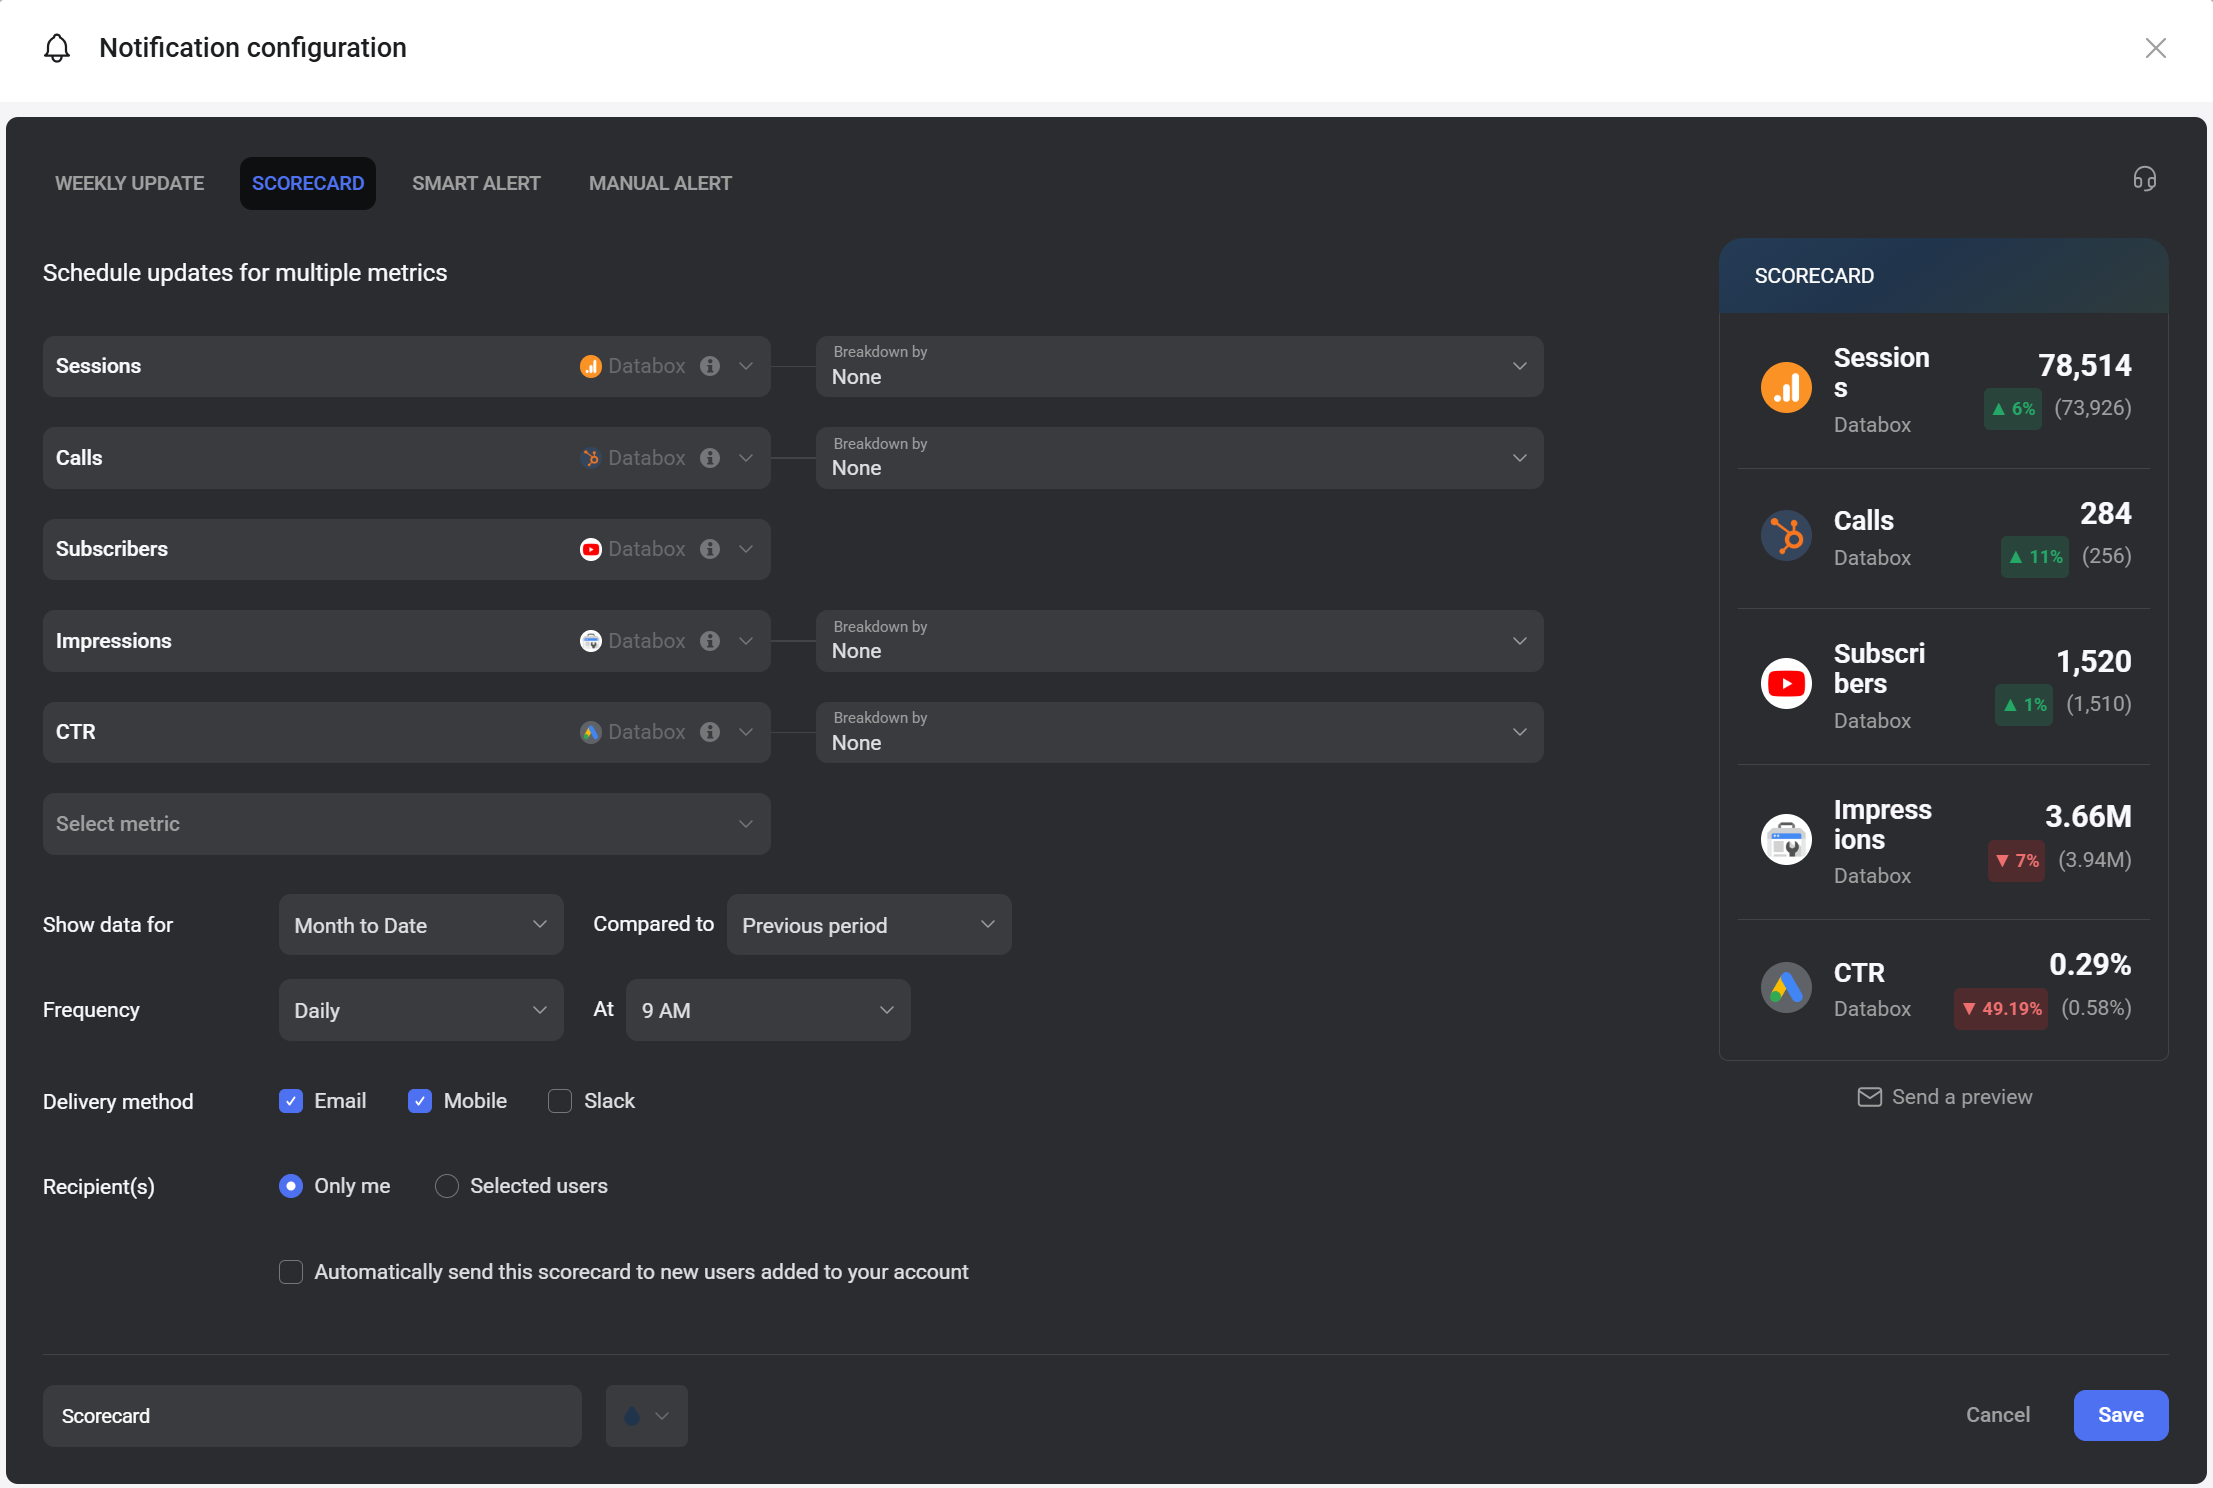
A scorecard sends scheduled updates for up to five metrics in a single notification.
- Metrics: Add up to five metrics across any connected data sources. Use the Unit dropdown to change the unit displayed.
- Show data for: The date range applied to all metrics in the scorecard (e.g., Month to Date).
- Compared to: The comparison period shown alongside each metric value (e.g., Previous period).
- Frequency / At: How often the scorecard is delivered and at what time.
- Delivery method: Select one or more of Email, Mobile, or Slack.
- Recipients: Choose Only me to receive it yourself, or select Selected users to add other Databox users as recipients.
- Automatically send this Scorecard to new users: When checked, any new user added to the account is automatically added as a recipient.
- Scorecard name: Enter a name for the scorecard. The name appears on the Scorecards page after saving.
- Send a preview: Click the headphones icon in the top-right corner to send a preview to yourself before saving.
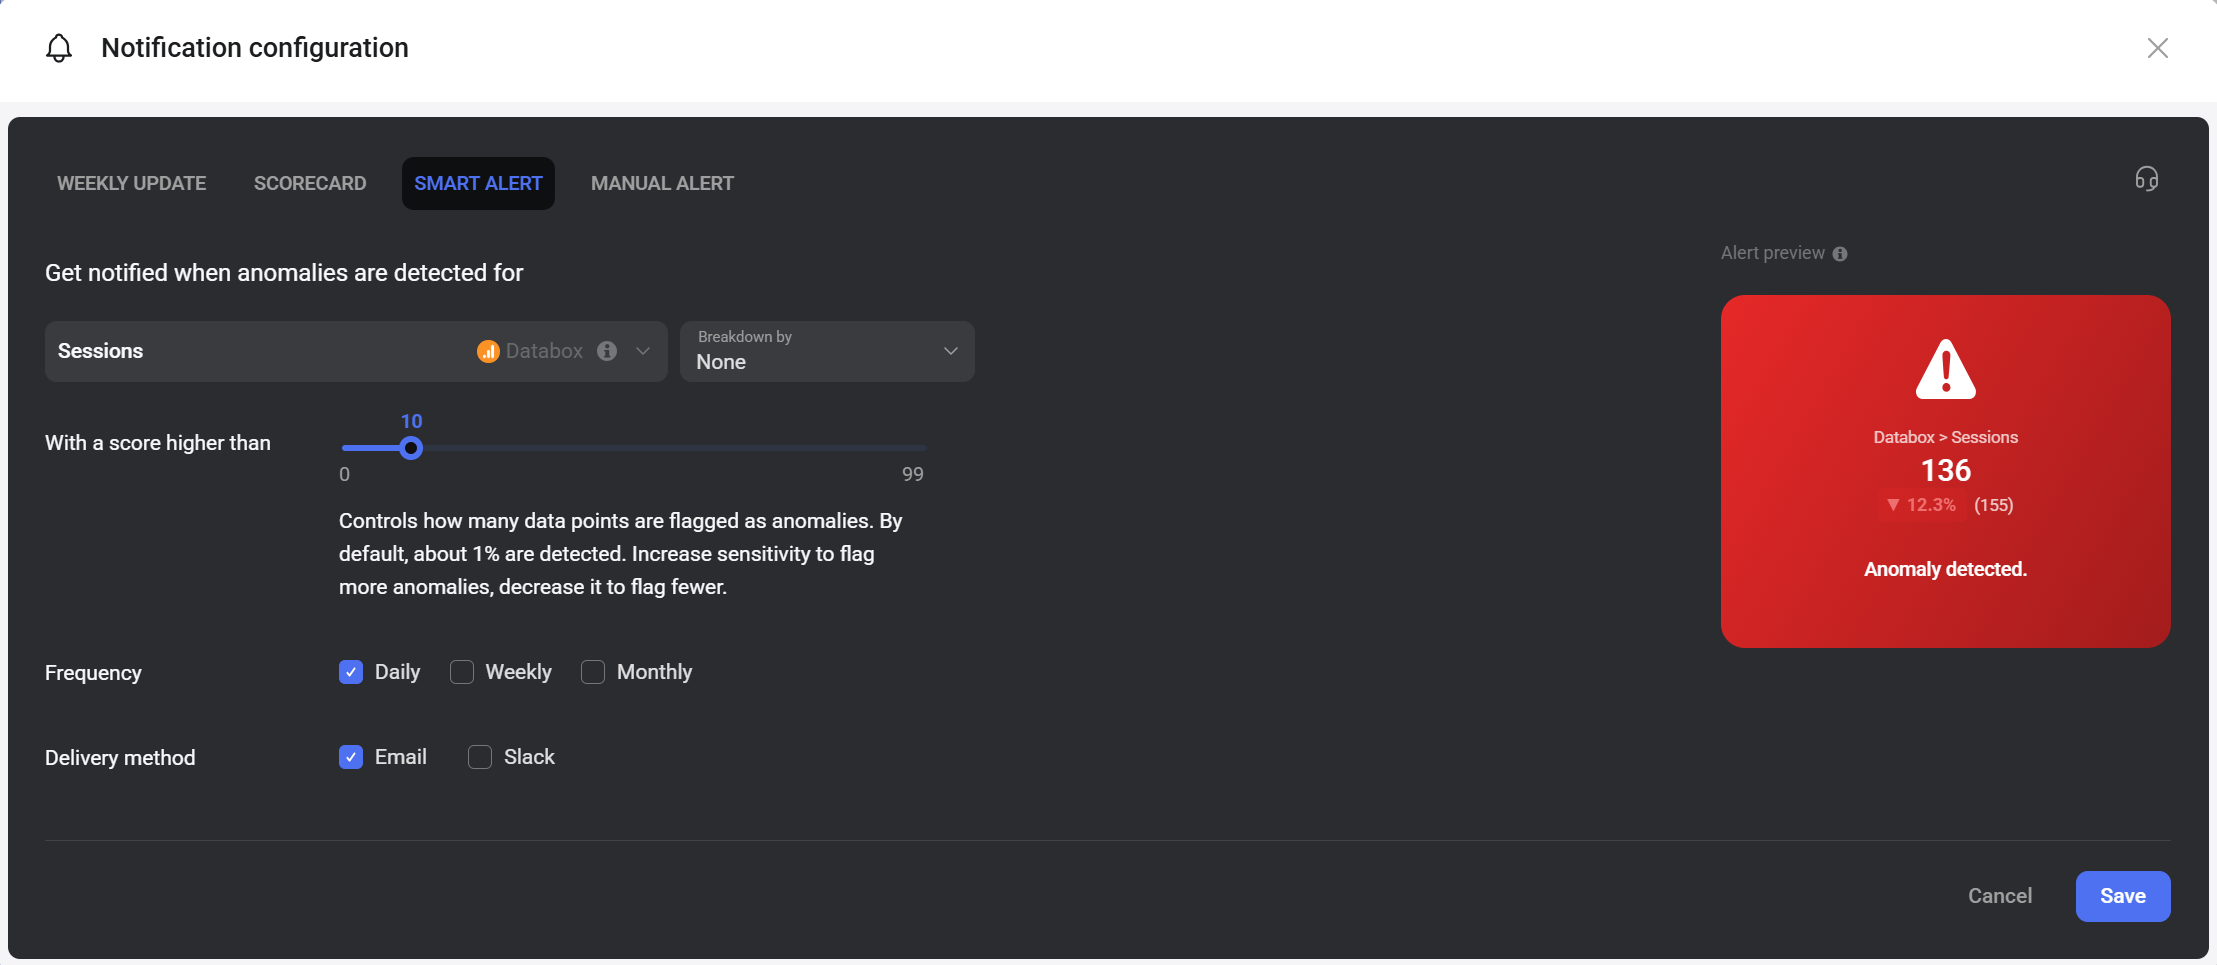
A Smart Alert uses anomaly detection to notify you when a metric behaves unexpectedly.
- Metric: The metric to monitor for anomalies. Use the Unit dropdown to change the unit displayed.
- With a score higher than: A sensitivity slider from 0 to 99. By default (score of 10), about 1% of data points are flagged as anomalies. Increase the score to flag more anomalies; decrease it to flag fewer.
- Frequency: Choose Daily, Weekly, or Monthly — multiple options can be selected.
- Delivery method: Select Email, Slack, or both.
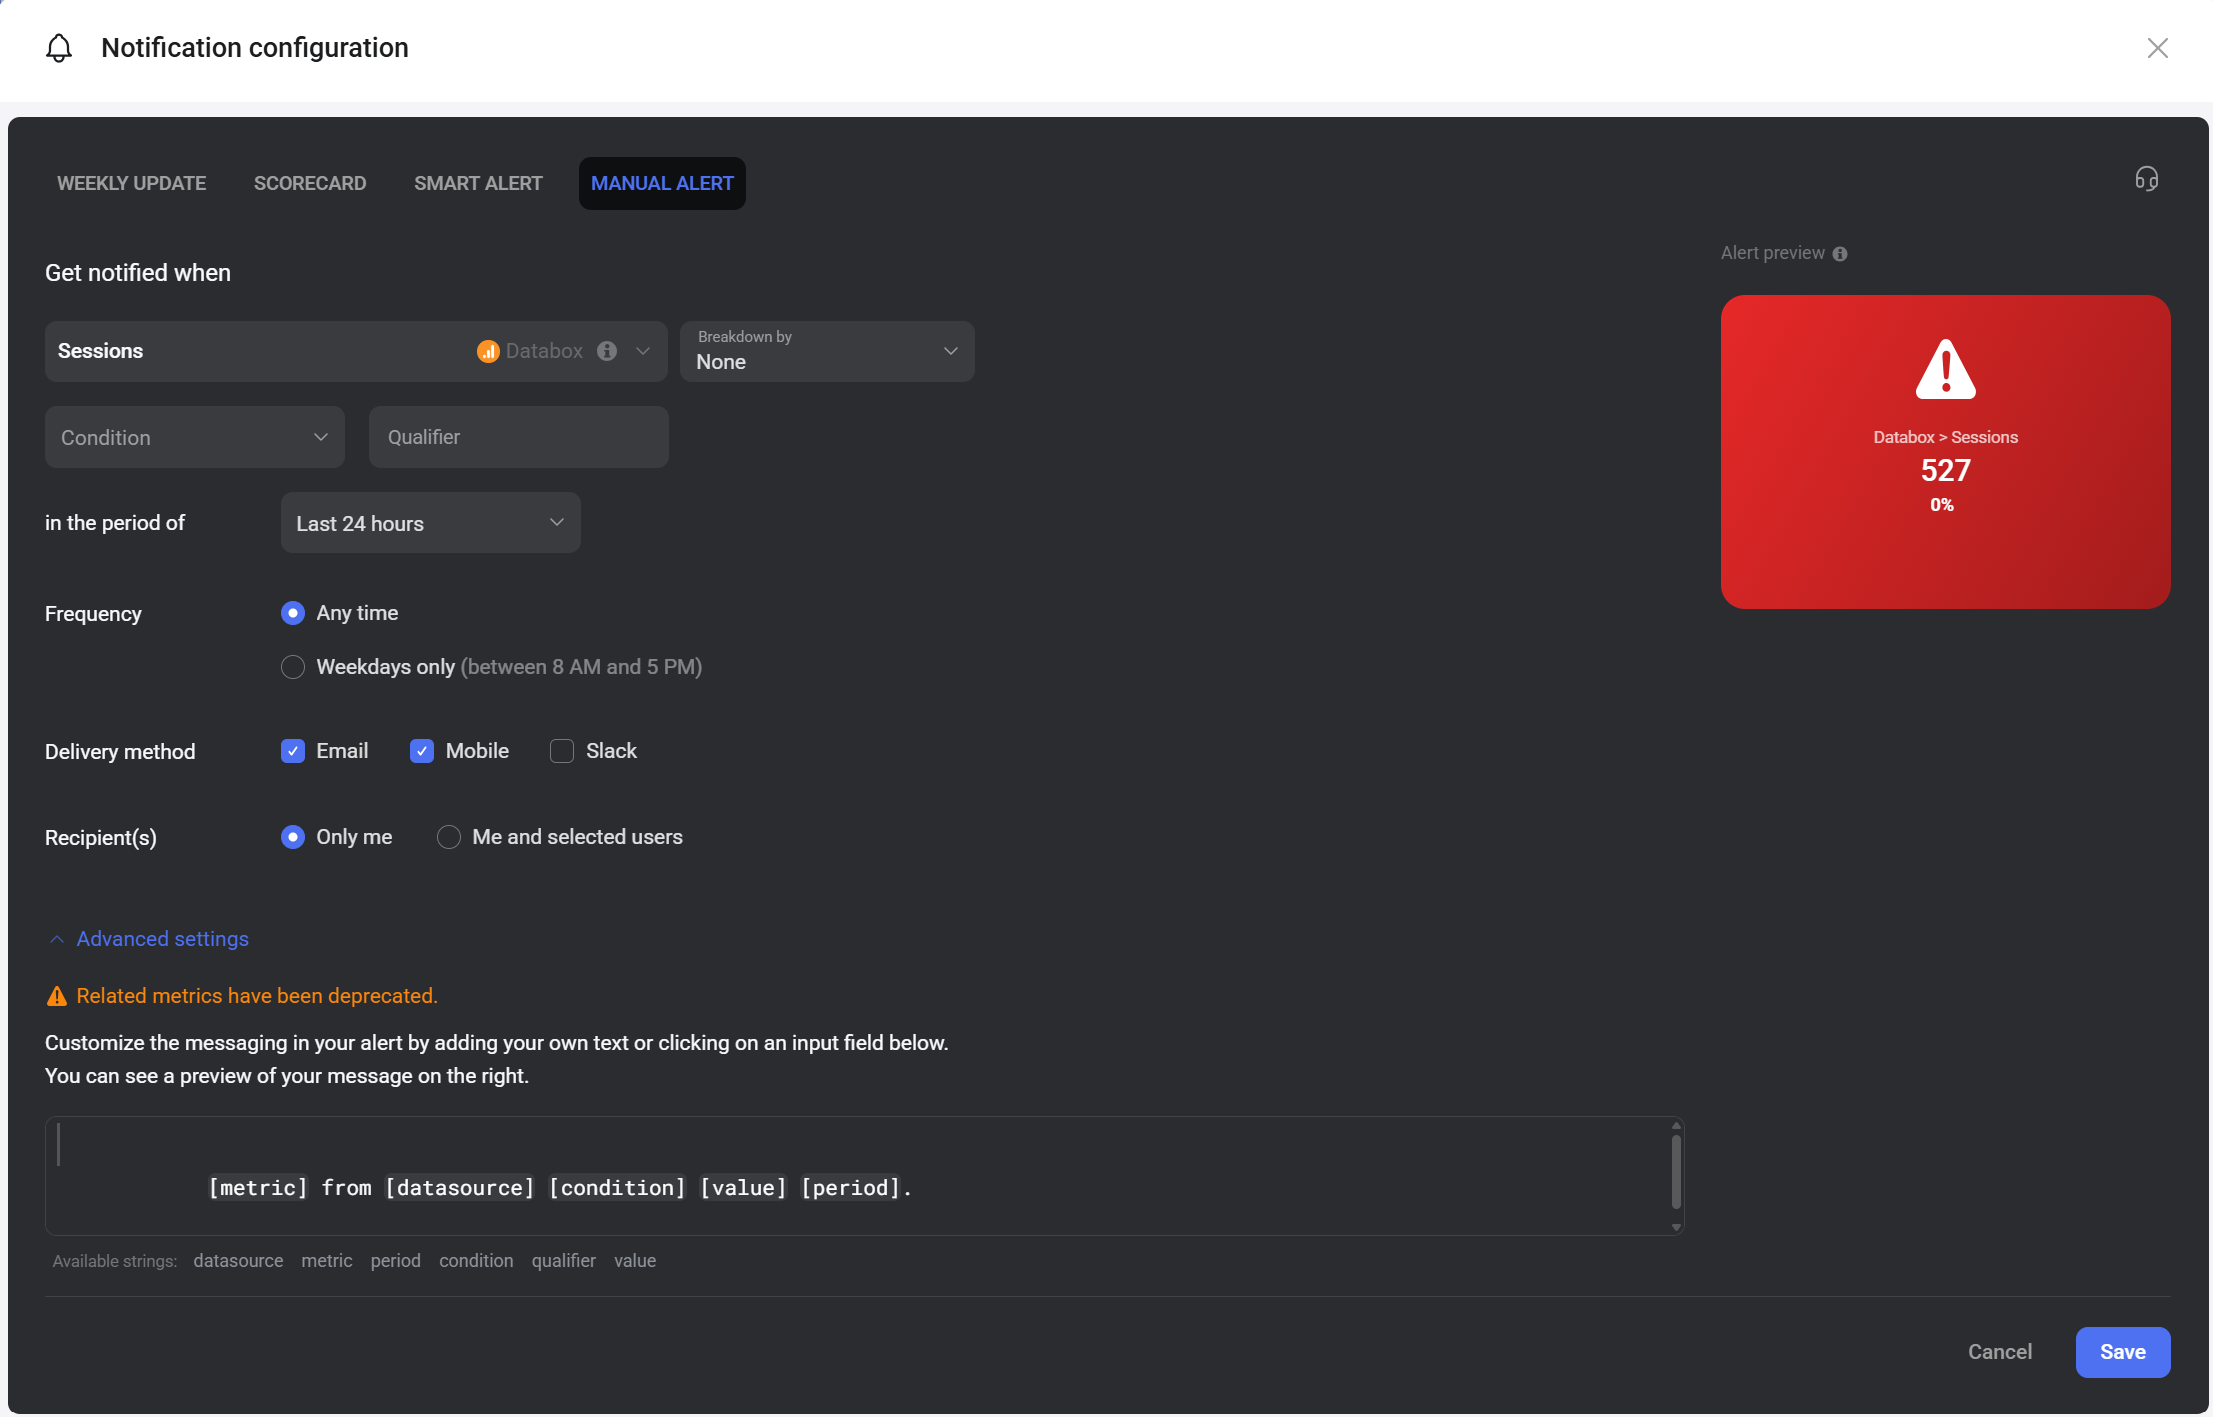
A manual alert notifies you when a metric meets a specific condition you define.
- Metric: The metric to monitor. Use the Unit dropdown to change the unit displayed.
- Condition: The type of change to watch for (e.g., increases above, decreases below, changes by).
- Qualifier: The threshold value that triggers the alert when the condition is met.
- In the period of: The date range over which the condition is evaluated (e.g., Last 24 hours).
- Frequency: Choose Any time to trigger whenever the condition is met, or Weekdays only to limit alerts to Monday–Friday between 8 AM and 5 PM in your profile's time zone.
- Delivery method: Select one or more of Email, Mobile, or Slack.
- Recipients: Choose Only me or Me and selected users to include other Databox users.
- Advanced settings: Expand to customize the alert message using placeholders such as [metric], [datasource], [condition], [value], and [period]. A live preview is shown on the right.
- Navigate to Settings > Notifications.
- Find the notification in the list and click Edit.
- Make your changes and click Save.
To delete the notification, click the down arrow (![]() ) and select Delete.
) and select Delete.
FAQ
Can I send a metric notification to someone outside my Databox account?
Metric notifications can only be sent to users in your Databox account. For sharing data with external stakeholders, use scheduled snapshots or scheduled reports instead.
What is the difference between a Smart Alert and a manual alert?
A Smart Alert uses automated anomaly detection — Databox identifies statistically unusual data points based on historical patterns. A manual alert is triggered by a specific condition and threshold you define, giving you precise control over when you are notified.


