Overview: Databox Benchmarks
Benchmark your company's performance to compare how you're doing against businesses like yours. You can now save Benchmarks in your Databox Analytics Account and use them to understand where you’re performing well, and where you have opportunities to improve.
The Databox Benchmarks feature is available on the Growth and higher plans. Request a trial of Databox Benchmarks by following these steps.
IN THIS ARTICLE
- Introduction to Databox Benchmarks
- How to access Databox Benchmarks
- How to use Databox Benchmarks
- How to add Benchmarks to your Databoards
- How is Data being calculated in Databox Benchmarks
- Additional Information
Introduction to Databox Benchmarks
The Databox Benchmarks feature has two dedicated pages within the Databox Analytics app:
- My Benchmarks: On My Benchmarks page, you can save and monitor your favorite benchmarks. This allows you to easily track and compare your performance against specific metrics that are relevant to your business and industry.
- Benchmark Explorer: The Benchmark Explorer page enables you to explore benchmarks for various metrics across different cohorts. You can select specific metrics of interest and explore how your performance compares to benchmarks within industries or chosen cohorts. This can help you get insights into performance trends, identify areas for improvement, and uncover best practices followed by top performers.
When it comes to improving performance, Benchmarks are more than just a comparison tool. They offer insights that you can use to:
- Set more realistic goals: Use benchmarks to set SMART goals. See what top performers in your industry are doing, and base your goals on that data, so they’re realistic and achievable.
- Find opportunities to improve: Track specific KPIs against benchmarks to pinpoint areas where you might be falling behind. Then, use these insights to invest in the right areas of growth.
- See where you are ahead of the curve: Identify and capitalize on areas where your business outperforms industry benchmarks, so you can double down on what’s working best and you can gain a competitive edge.
- Prove results to clients, investors, managers, and your board: Show stakeholders where your team is outperforming peers and the potential of where you could be.
Pro Tip: For additional information about the value of Benchmarks in your business, learn more here.
How to access Databox Benchmarks
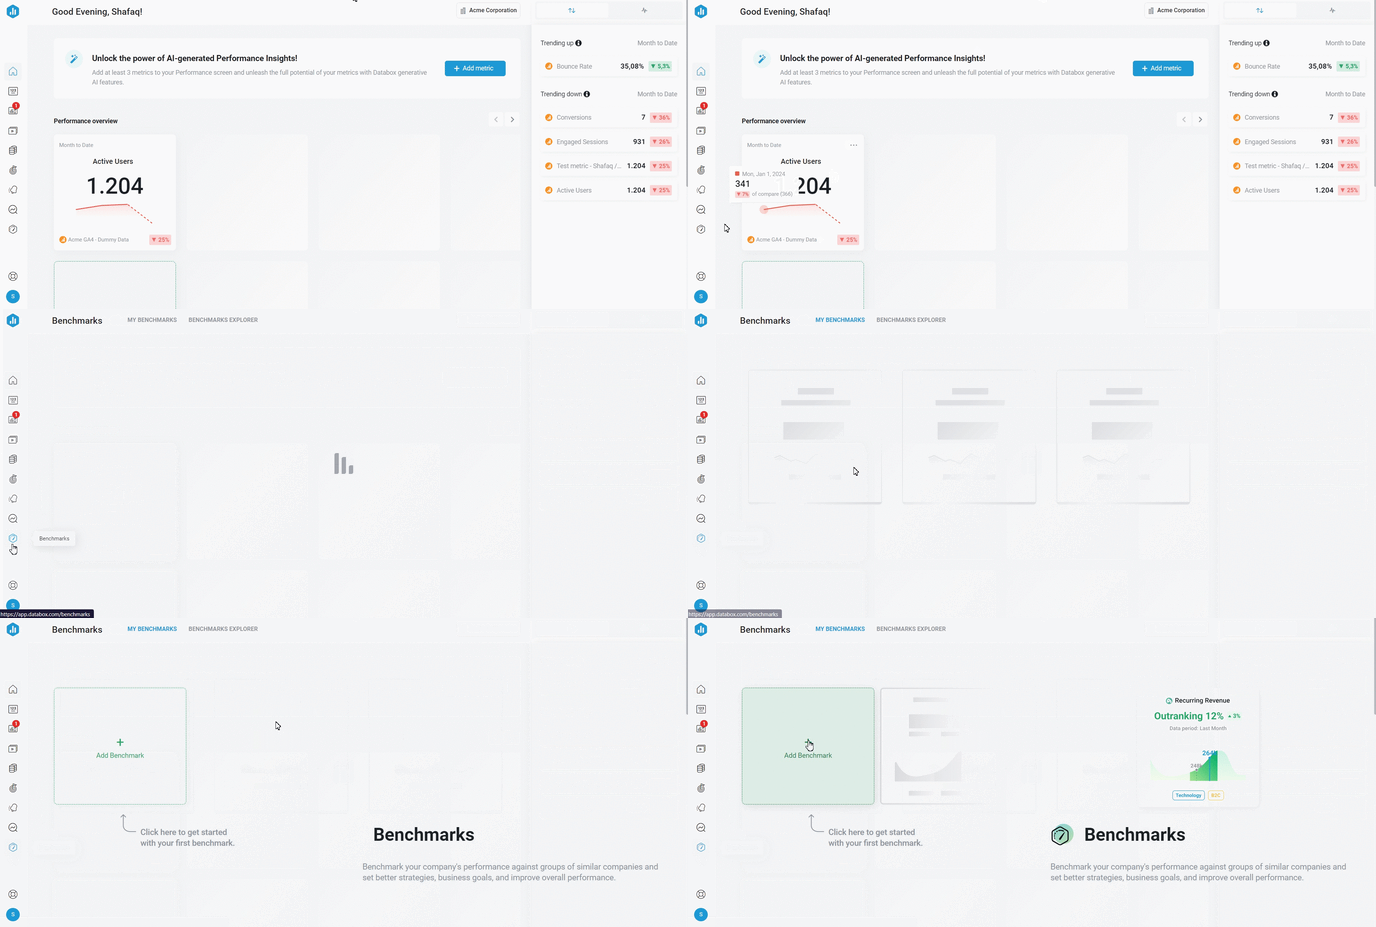 Open your Databox Analytics Account and navigate to Benchmarks in the left-hand navigation.
How to use Databox Benchmarks
IN THIS SECTION
- How to add a Benchmark
- How to add a Benchmark [Example]
- How to read a Benchmark
- How to view details of a Benchmark
- How to remove a Benchmark from My Benchmarks
How to add a Benchmark
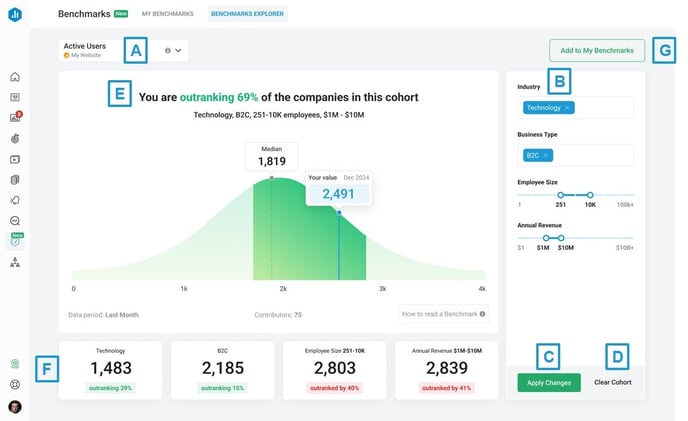
- A) Metric Selection: Click on the Metric drop-down list to select the Metric for your Benchmark. You can filter out metrics for a specific Data Source using the Data Source drop-down. You can further filter the metrics by using the Metric type drop-down to select between Favorite, Popular, and Basic Metrics.
Pro Tip: Metrics that you cannot select for Benchmarks are:
-
Dimensional Metrics
-
Custom Metrics
-
Calculated Metrics
-
Metrics made with token
-
Excel or Google Sheet Metrics
- SQL Integration Metrics
-
Custom API Integration Metrics
- Third Party Integration Metrics
-
Beta Integration Metrics
- B) Cohort Selection: There are four fixed categories which you can select for your Benchmark cohort: Industry, Business Type, Employee Size and Annual Revenue.
- Industry: Select the Industries for your Benchmark cohort from the drop-down list. You can also type the Industry and then select it.
- Business Type: Select the Business Types for your Benchmark cohort from the drop-down list. You can also type the Business Type and then select it.
- Employee Size: Select the Number of Employees for your Benchmark cohort by using the slider.
- Annual Revenue: Select the Annual Revenue for your Benchmark cohort by using the slider.
Pro Tip: You have to select a specific range for the Employee Size and Annual Revenue categories. If you select the whole range of the Employee Size and Annual Revenue, these categories will not be applied to the cohort.
- C) Apply Changes: Click on this to apply your cohort settings.
- D) Clear Cohort: Click on this to clear your selected cohort settings.
- E) Benchmark Chart: At the top of the Benchmark chart, there is a Data Story summarizing your performance. Below the Data Story is the Cohort Summary, that shows your cohort selection. The Benchmark chart shows the Median value, your value and top and bottom Quartile.
Learn how to read the Benchmark here. - F) Cohort Boxes: The cohort boxes are populated with data based on your cohort selection.
- G) Add to My Benchmarks: Click on this to add your Benchmark to your My Benchmarks page.
Pro Tip: Benchmarks are calculated on the 5th day of each month. Learn more here.
How to add a Benchmark [Example]
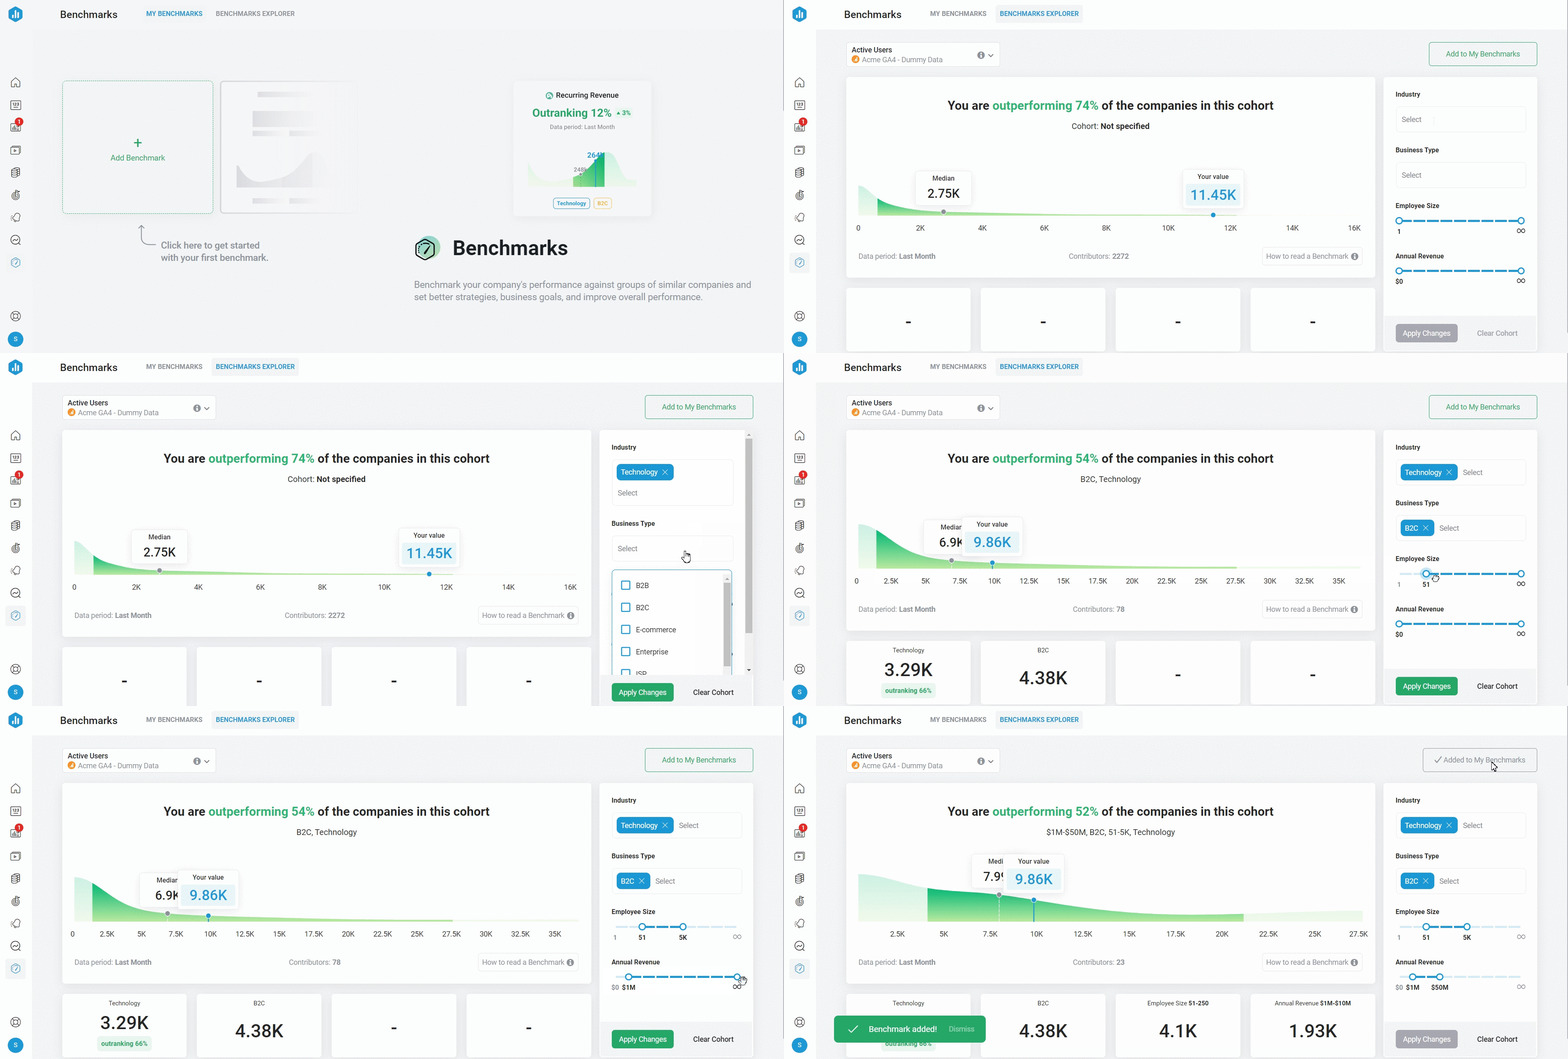
- On My Benchmarks page, click on Add Benchmark. This will take you to the Benchmark Explorer.
Pro Tip: By default, your most popular favorited metric will be displayed in the Metric selection box. Learn about Favorite Metrics here.
Pro Tip: Metrics that you cannot select for Benchmarks are:
-
Dimensional Metrics
-
Custom Metrics
-
Calculated Metrics
-
Metrics made with token
-
Excel or Google Sheet Metrics
- SQL Integration Metrics
-
Custom API Integration Metrics
- Third Party Integration Metrics
-
Beta Integration Metrics
3. Select the Industries for your Benchmark cohort from the drop-down list. We'll select Technology as the Industry.
4. Select the Business Types for your Benchmark cohort from the drop-down list. We'll select B2C as the Business Type.
5. Select the Employee Size for your Benchmark cohort. We'll select 51 - 5K as the Employee Size.
6. Select the Annual Revenue for your Benchmark cohort. We'll select 1M - 50M as the Annual Revenue.
7. Click on the green Apply Changes button to apply your cohort selection.
8. Click on the Add to My Benchmarks button on the top right-hand side of the Explorer to add your Benchmark to My Benchmarks page.
Pro Tip: You can add the same Metric multiple times to your My Benchmarks page if you change the cohort settings of the Benchmark.
How to read a Benchmark
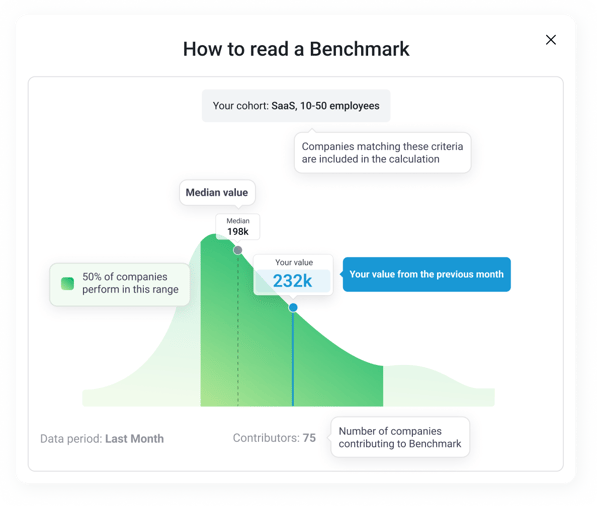
At the top of the Benchmark chart, there is a Data Story summarizing your performance. Below the Data Story is the Cohort Summary, that shows your cohort selection. Under the Benchmark chart, you can see the number of companies contributing to the Benchmark.
The Benchmark chart shows the median value, your value and the quartile range:
- Your Value: This shows your metric’s performance for the previous month.
- Median Value: This highlights the middle point in the cohort. The Median is the value lying at the midpoint of the frequency distribution of data.
- Light color chart area: The light colored area on the chart represents the values of the Top and Bottom 25% of companies which perform in this cohort.
- Darker color chart area: The darker-colored area on the chart represents your quartile range. It highlights the values which 50% of companies in this cohort perform within.
The color of the chart changes according to your performance:
-
Green: This is displayed if the metric is outperforming more than 50% of the companies within the cohort.
-
Red: This is displayed if the metric is outperformed by more than 50% of the companies within the cohort.
-
Blue: This is displayed when there's no data for selected metrics in your account (Data Source is not connected or data is not synced).
How to view Details of a Benchmark
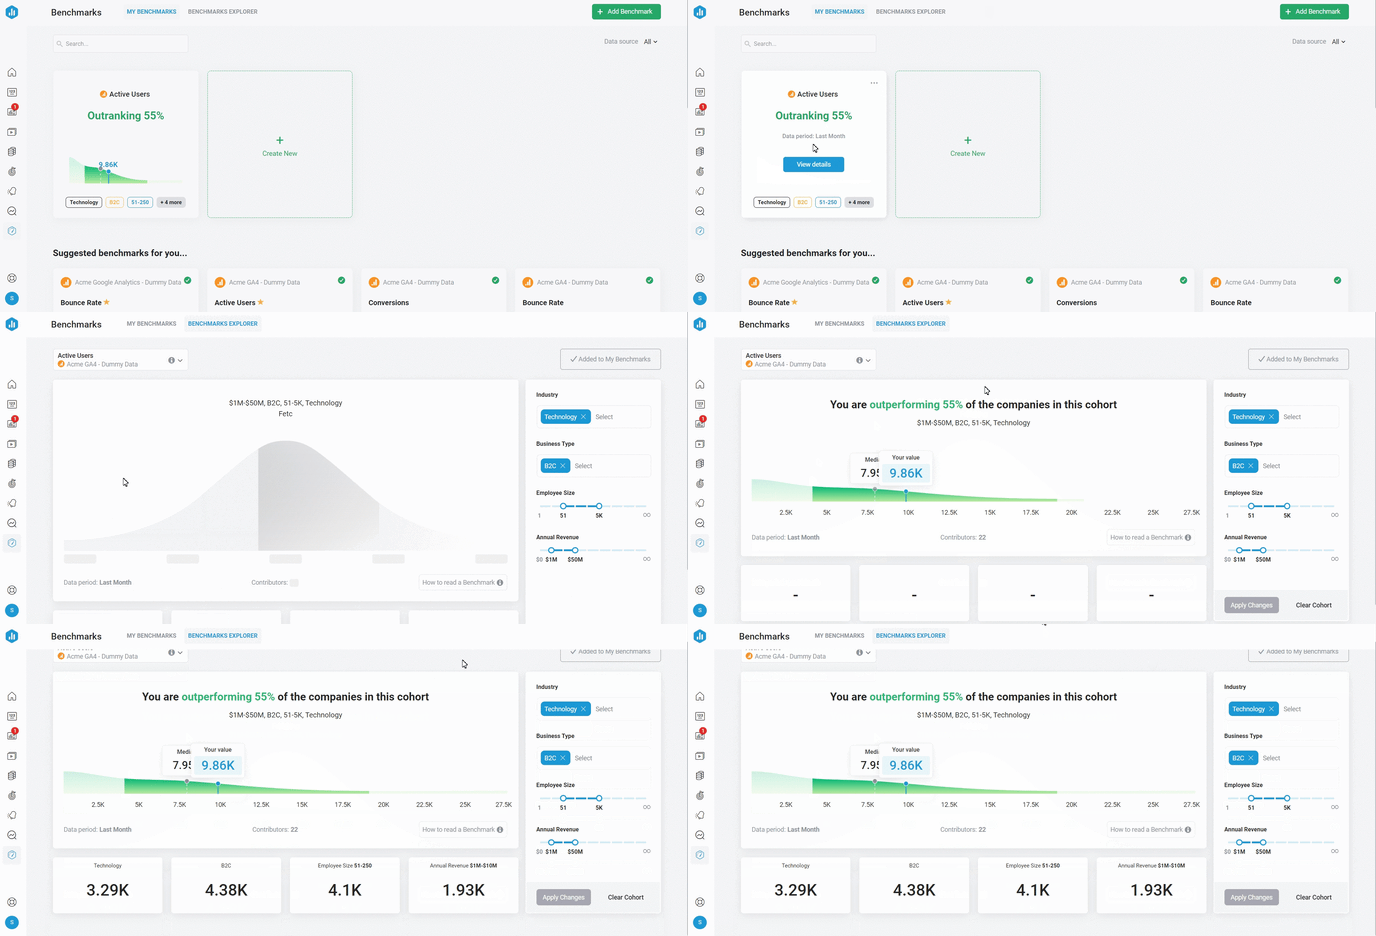
On My Benchmarks page, hover over the Benchmark that you want to view details for and click the View Details button.
How to remove a Benchmark from My Benchmarks
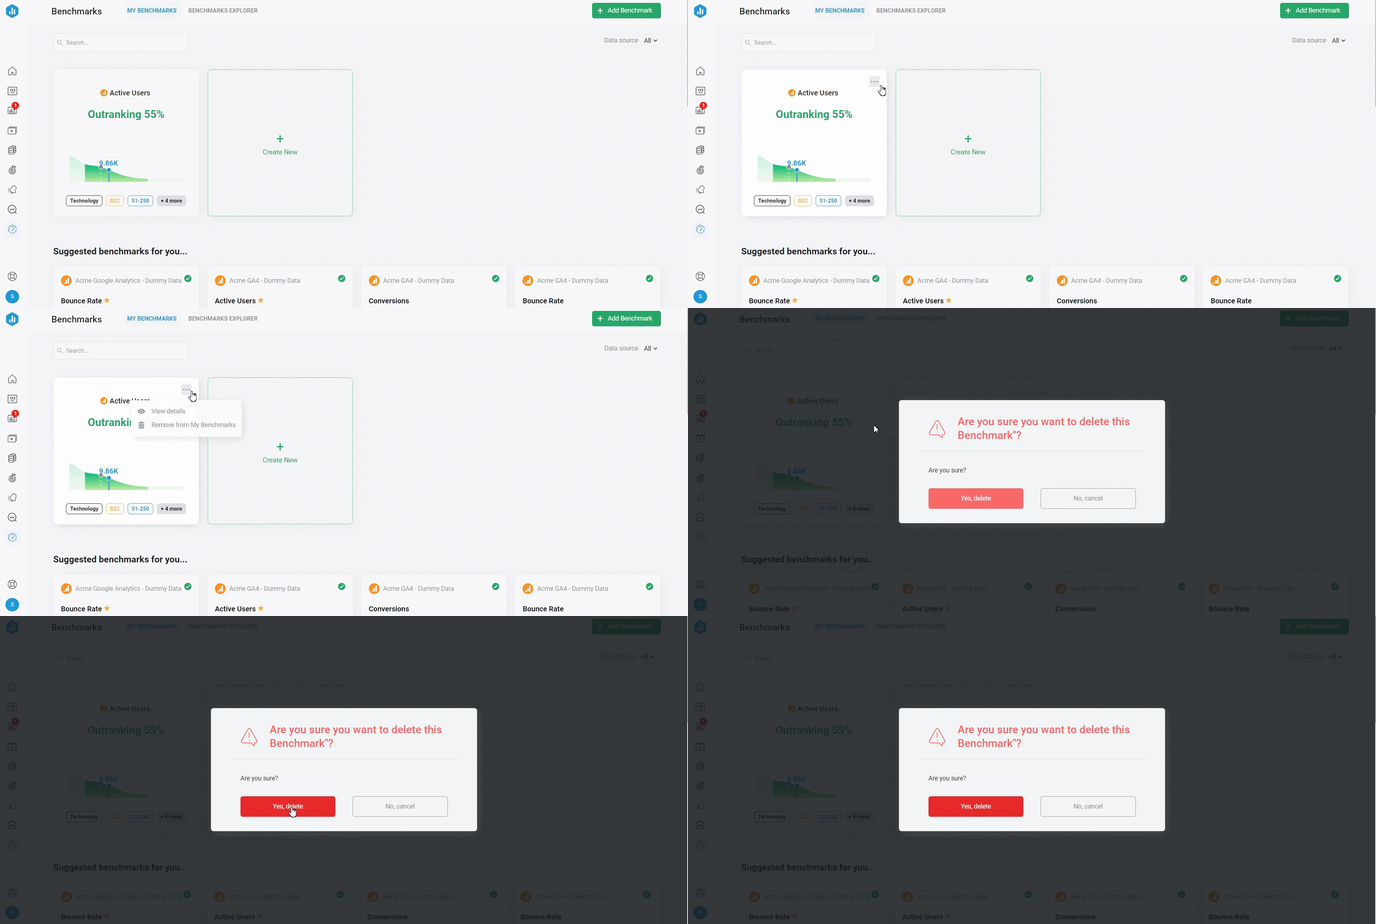
On My Benchmarks page, hover over the Benchmark that you want to remove. Click the three dots in the top right-hand side of the Benchmark and click on Remove from My Benchmarks.
How to add Benchmarks to your Databoards
Learn how to add Benchmarks to your Databoards here.
How is data being calculated in Databox Benchmarks
Learn how data is being calculated in Databox Benchmarks here.
Additional Information
- Benchmarks are calculated on the 5th day of the month, which means that benchmarks for a specific Metric and selected cohort will remain the same from 5th of the first month to 4th of the second month. Please contact our Support Team via chat if you need additional assistance.