
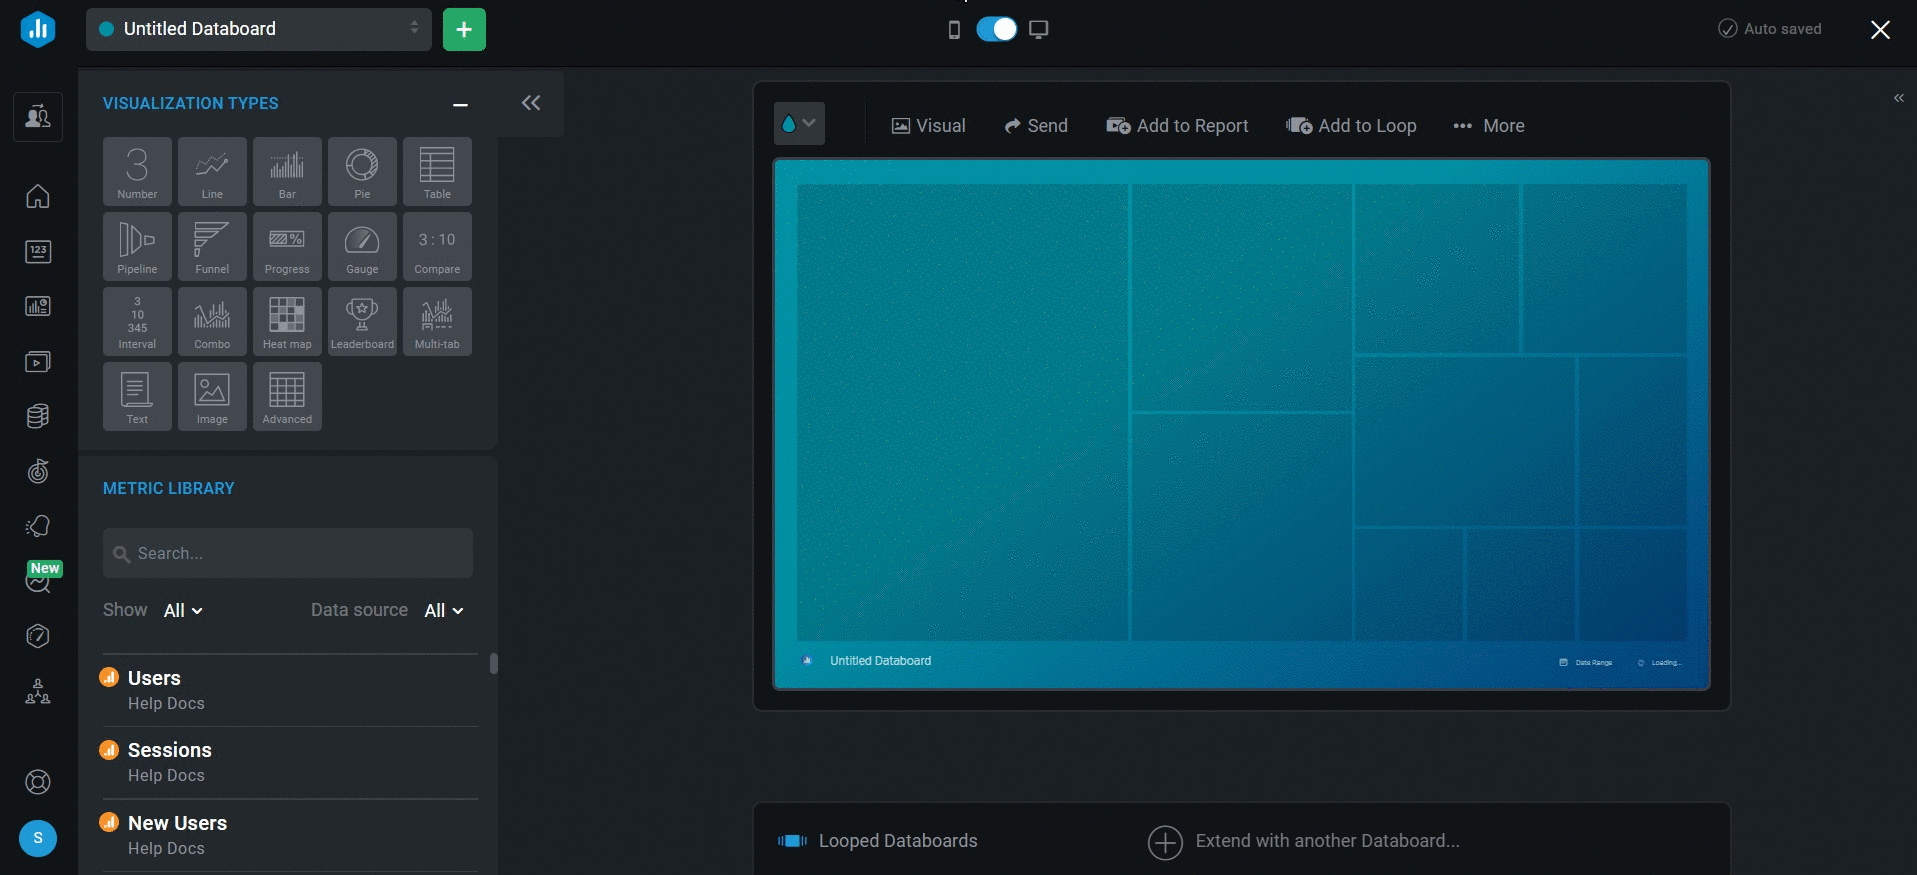
The Datablock Library is located on the left-hand side of the Designer. From here, you can add Datablocks to your Databoards. The Datablock Library consists of two sections: the Visualization Library and the Metric Library.
If you want to start with a blank Datablock, you can either drag and drop from the Visualization Library or click a blank Visualization Type to add it to your Databoard. You can then use the Datablock Editor to map this Datablock to a specific Data Source and Metric, select the most significant Date Range, change the comparison period, and more.
 Learn more about the Visualization Library here.
The Metric Library consists of over 3,000 pre-built Datablocks based on commonly used Metrics and Visualization Types to help you build new Databoards faster.
 Learn more about the Metric Library here.