1. Help Center
  2. Benchmark Groups

Overview: Benchmark Groups

Databox's Benchmark Groups product allows you to benchmark your company's performance against groups of similar companies and helps you set better strategies, business goals, and improve overall performance. A Benchmark Group is defined by cohort characteristics, such as company size, yearly revenue, type of business or industry, and the selected set of metrics from different sources. 

In this document, we will review the guidelines and key features to help you join, create and set up a Benchmark Group, so you can effectively compare your performance data.

    The following actions made in your Benchmark Groups Account will be reflected in your Databox Analytics Account as well:
  • Managing Data Sources (e.g. adding, reconnecting, or deleting a Data Source)
  • Managing Users (e.g adding or deleting a User)
  • Managing Clients (e.g adding or deleting a Client)
  • Updating Company information


Pro Tip: Agencies are also able to use Benchmark Groups for comparing performance for their Client Accounts. Learn more about how to become a Databox Agency Partner here.

HOW TO

How to access Benchmark Groups

You can access the Benchmark Groups page at http://benchmarks.databox.com/.

How to manage your Benchmark Groups Account

IN THIS SECTION

How to login to your Benchmark Groups Account (Databox Analytics Users)

If you already have a Databox Analytics Account, follow the steps below to login:

  1. Open https://benchmarks.databox.com/ and navigate to  Login at the top right-hand side.
  2. Enter your login credentials and click the blue  Sign in button. 

How to login to Benchmark Groups Account (non-Databox Analytics Users)

If you don't have a Databox Analytics account, follow the steps below to set up your account:

  1.  Open https://benchmarks.databox.com/ and navigate to Sign Up at the top right-hand side.
  2. Enter your Personal and Company Information.
  3. Once you've enter all the information, click the blue Create account button to create your Benchmark Account.

How to edit your Benchmark Groups Account

You can edit your Benchmark Groups Account by navigating to the Account and selecting a desired option from the drop-down, such as Profile, Data management, User management, Client Management or Company information.

A) Profile: Edit your profile information here, such as name, email and password, etc. 
B) Data management: Benchmark Data Management will display the Data Sources as they are set up in the Databox app You can also connect, reconnect, edit or delete a Data Source here. Learn more about Data management here.
C) User management: Benchmark User Management will display the users as they are set up in the Databox app. You can add users, set their roles and delete them in the Databox app. Learn more about User Management here.
D) Client Management:  Benchmark Client Management will display the Client Acconts as they are set up in the Databox app. You can add and remove Clients Accounts in Client Management an you can also switch between the Agency and Client Accounts. 
E) Company information:  Edit your company information here, such as basic and company segmentation information. 

How to switch between Agency and Client Accounts

Only Agency Accounts have access to Client Accounts. Learn more about how to become a Databox Agency Partner here

To switch between your Agency and Client Accounts, follow the steps here

How to use Metric Search 

Metric Search allows you to search for a Metric and, based on that Metric, select the group you want to join.You can filter the Metric by a Data Source or by the cohort filters of the group such as Company size, Business Type, Annual Revenue and Industry. 

 
1. Navigate to Metric Search
2. Type the  Metric name in the search field, such as  Sessions
3. Select the  Data Source using the  Data Source drop-down list. We'll select HubSpot Marketing as the Data Source. Click the green Search button.
4. You can further drill down the Metric by selecting additional filters such as Company size, Business Type, Annual Revenue and Industry. We'll select the Busines Type B2C
5. Scroll down to view the Metrics that match your filters. To view a group for a specific Metric, click on View Group.

Pro Tip: The Benchmarks of the Metrics will only be visible if the Data Source you have searched the Metric for is connected in your Account. If that specfic Data Source has not been connected, you will have to connect the Data Source to view the Benchmark. 

6. If you are interested in the group, click on the blue  Join Group button. 

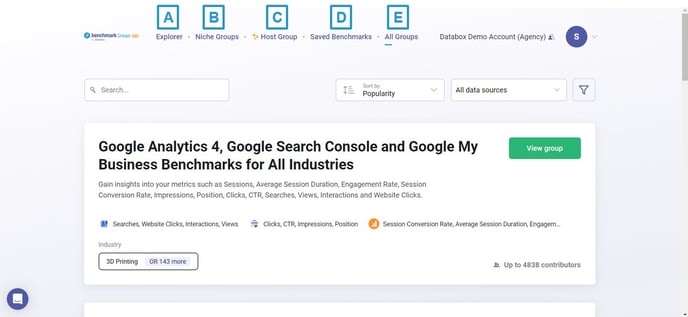
How to view Benchmark Groups 

 
A) Joined  Groups: Consists of all of the groups you have joined. As a group member, you are able to view the benchmarks of the groups you have joined if you meet the specified group criteria and if you have data available for the specific benchmark.
B) My Groups: Consists of all of the groups you have created. As a group owner, you can create an invite-only Benchmark Group by defining conditions for your group and setting the required Data Sources and Metrics. 
C) All Groups: Consists of all of the open groups (public groups) you can join. You can filter the Benchmark Groups by Industry sector, Number of employees, Annual revenue and Business type.

How to use Benchmark Groups

IN THIS SECTION

How to use Joined Groups

 
A) Group name: Shows the name of the group you have joined.
B) View group: Click the View Group button to view the Benchmarks of the groups you have joined. The Benchmarks will only be displayed if you meet the group criteria and if you have data available for the specific benchmarks.
C) Data Sources and Metrics: The Data Sources you have connected to view the Benchmarks of the group.
D) Group criteria: The criteria of the Benchmark group you have met in order to be part of it.
E) Group contributors: The contributors who have contributed with their data for the Benchmarks of this group.

How to use My Groups

    Creating your own Benchmark Groups gives you control over which data sources and metrics are included in your Benchmark and allows you to invite (and remove) members from your group.
 
A) Create new group: Click the + Create new group button to create a new group. Learn how to create a group here.
B) Manage group: Click the Manage group button to view the Benchmarks and the Members of the groups you have created. To edit your group name, group limitations and the required Metrics and Data Sources, click on Manage group > Edit group.
C) Group name: This shows the name of the group you have created. 
D) Data Sources and Metrics: The Data Sources required for your Benchmarks. Members of your group will have to connect these Data Sources in order to view the Benchmarks of the group.
E) Group criteria: The group criteria that you have set and all members need to meet it in order to be part of group. 
F) Group contributors: The contributors who have contributed with their data for the Benchmarks of your group.

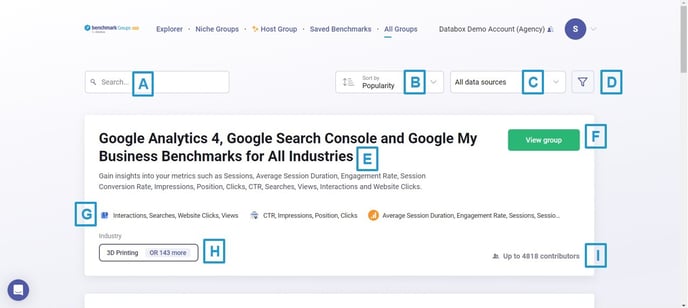
How to use All Groups

 
A) Search: Use the Search bar to find any specific group you want to join.
B) Group filters: Click the drop-down arrows to filter the groups. You can filter the benchmark groups by Industry sector, Number of employees, Annual revenue and Business type. Additionally, you can sort groups by Popularity, Most recent, Name ascending and Name descending. 
C) Group name: This shows the name of the group you can join.
D) View Group: Click View Group > Join group in order to join the group.
E) Data Sources and Metrics: The Data Sources you will have to connect to contribute to the Benchmarks.
F) Group criteria: The criteria of the group you have to meet in order to join the selected group.
G) Group contributors: The contributors who have contributed with their data for the Benchmarks of the group.

How to join Benchmark Groups

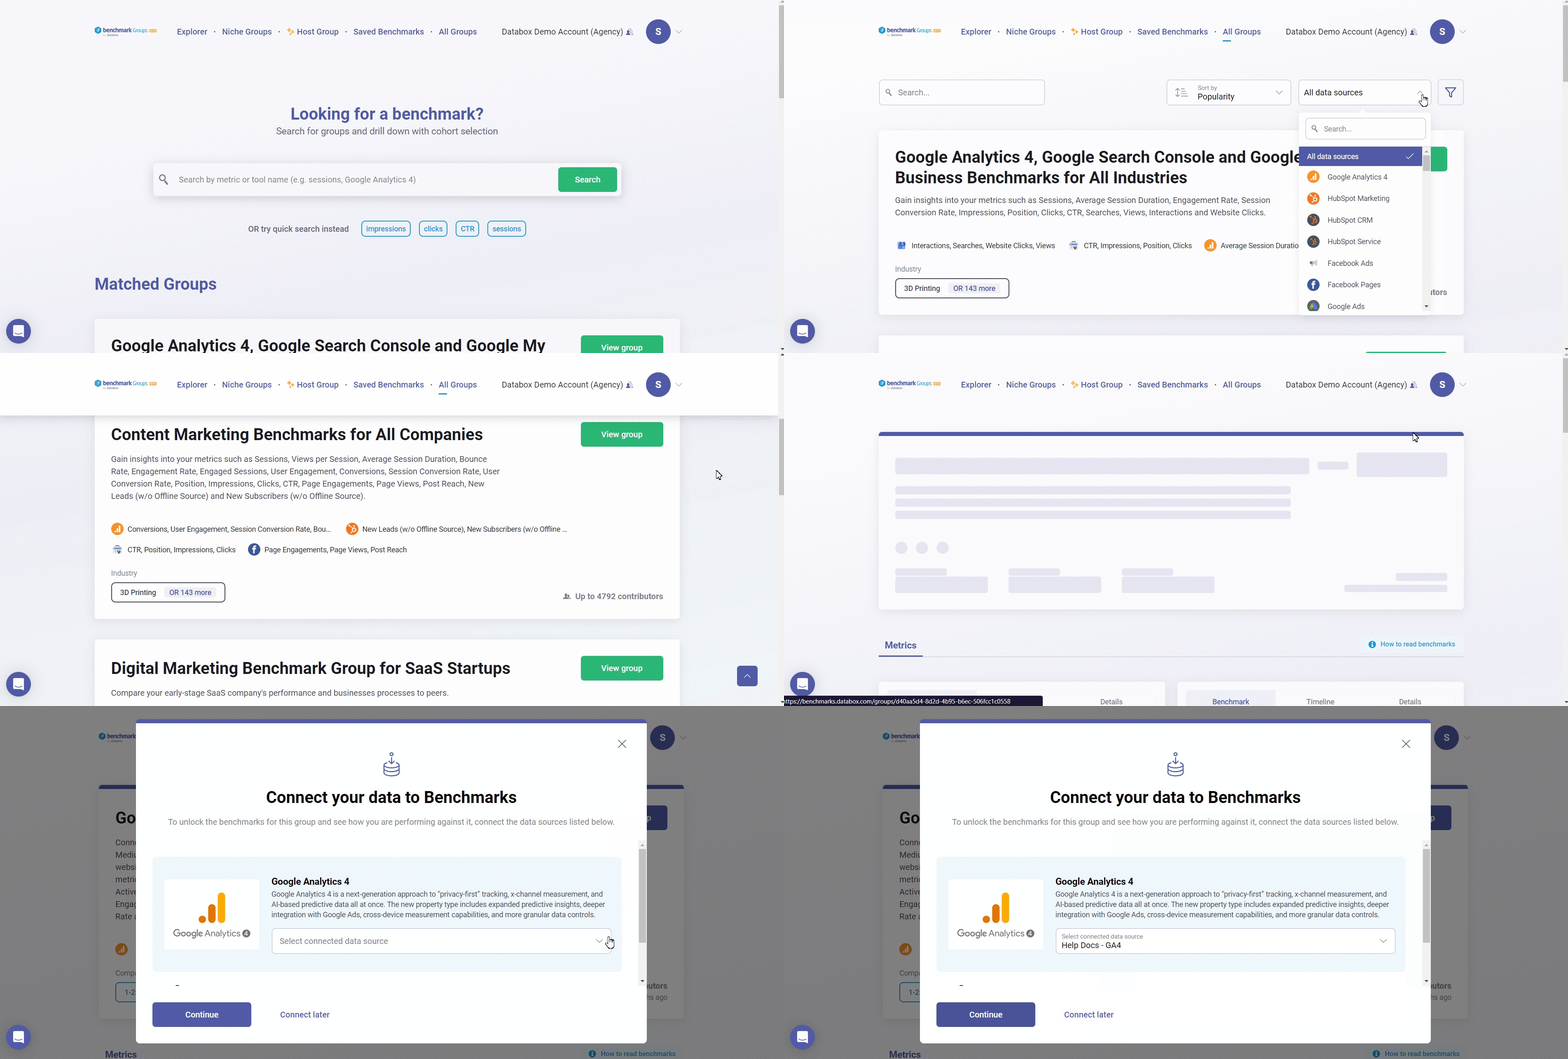
1. Navigate to All Groups.

2, Next, navigate to the group you would like to join and click the green View  group button.
3. Click on the blue + Join group button. This will open a new window where you will be prompted to connect your Data Source(s).
4. Select your Data Source(s) from the drop-down. If you don't have the required Data Source connected, click the green Connect New button to connect it.

Pro Tip: To join a group, you have to connect at least one Data Source in the group. You'll be able to see Benchmarks in the group only for Data Sources you've connected.

5. Next, click on the blue Continue button to join the group.   

How to share Benchmark Groups

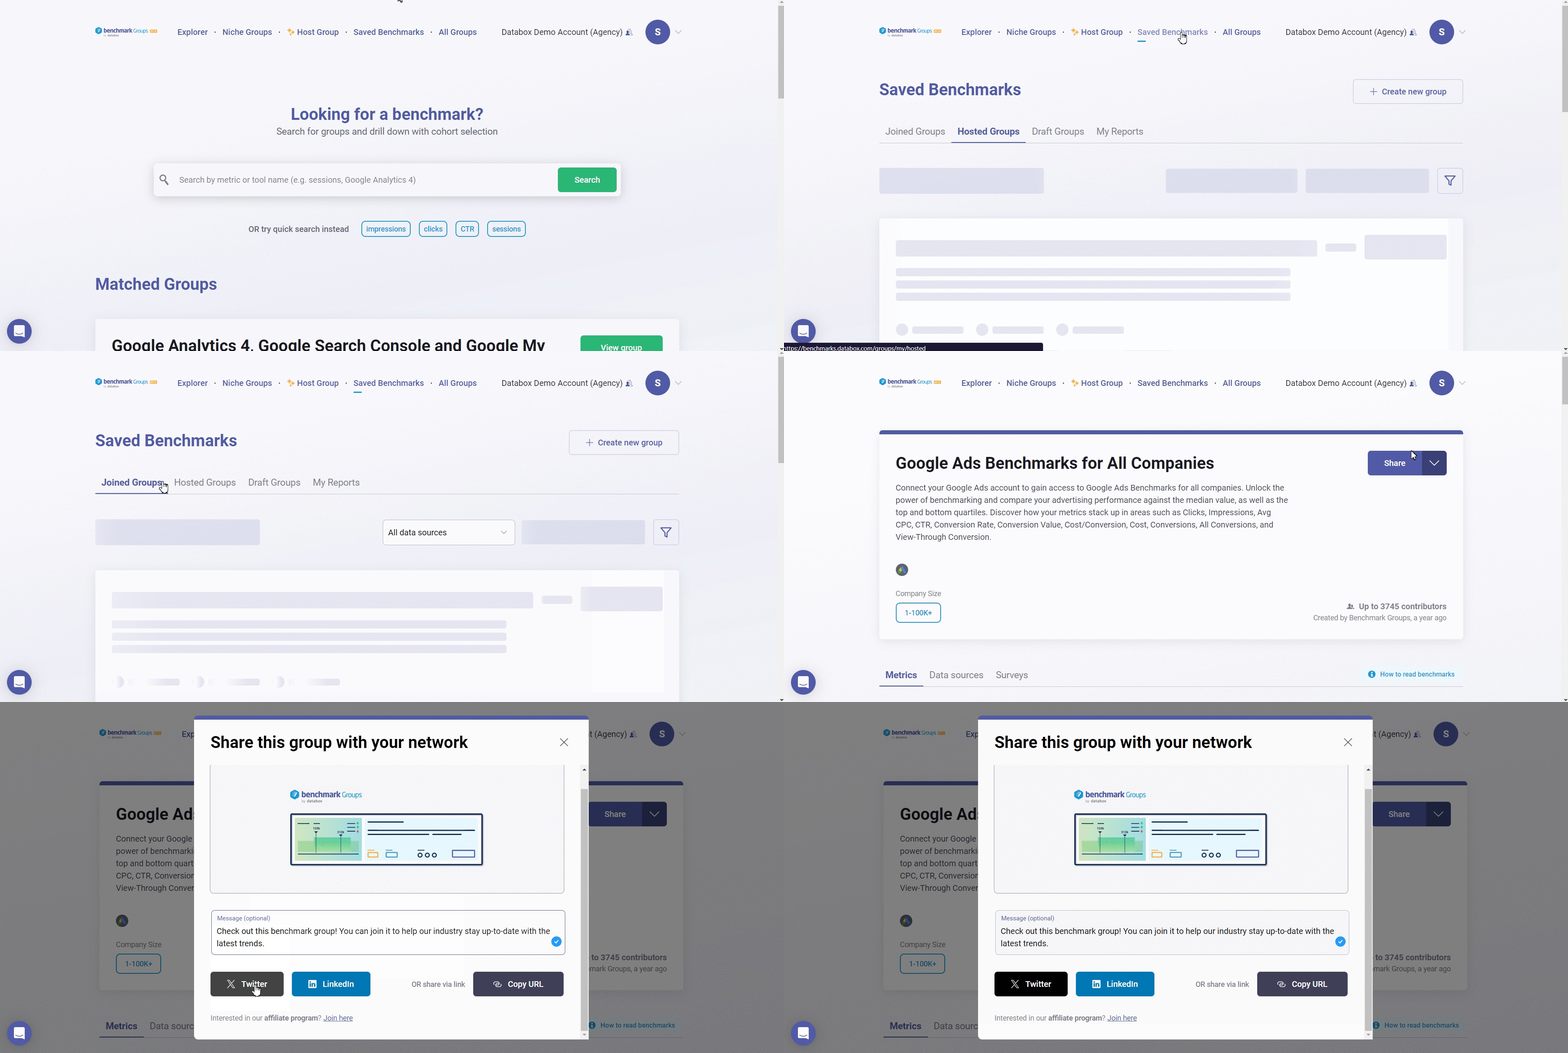
  1. Navigate to Joined Group.
  2. Next, navigate to the group you would like to share and click the green View  group button.
  3. Click on the blue Share button.
  4. Click on the blue   Copy URL button, you can paste this URL in an email, slack etc. to share this group with anyone who would like to join this specific Benchmark Group. 

How to create Benchmark Groups

Creating your own Benchmark Groups gives you control over which data sources and metrics are included in your Benchmark and allows you to invite (and remove) members from your group.

IN THIS SECTION

How to create a Group [Example]

Pro Tip: The Benchmark Group you create as a group owner will be a invite-only group (accessible by invite only) and will not be visible to the public. You can invite members to join your group after you have created it, Learn more here.

1. Navigate to My Groups and click the + Create new group button. This will create a draft of the group.
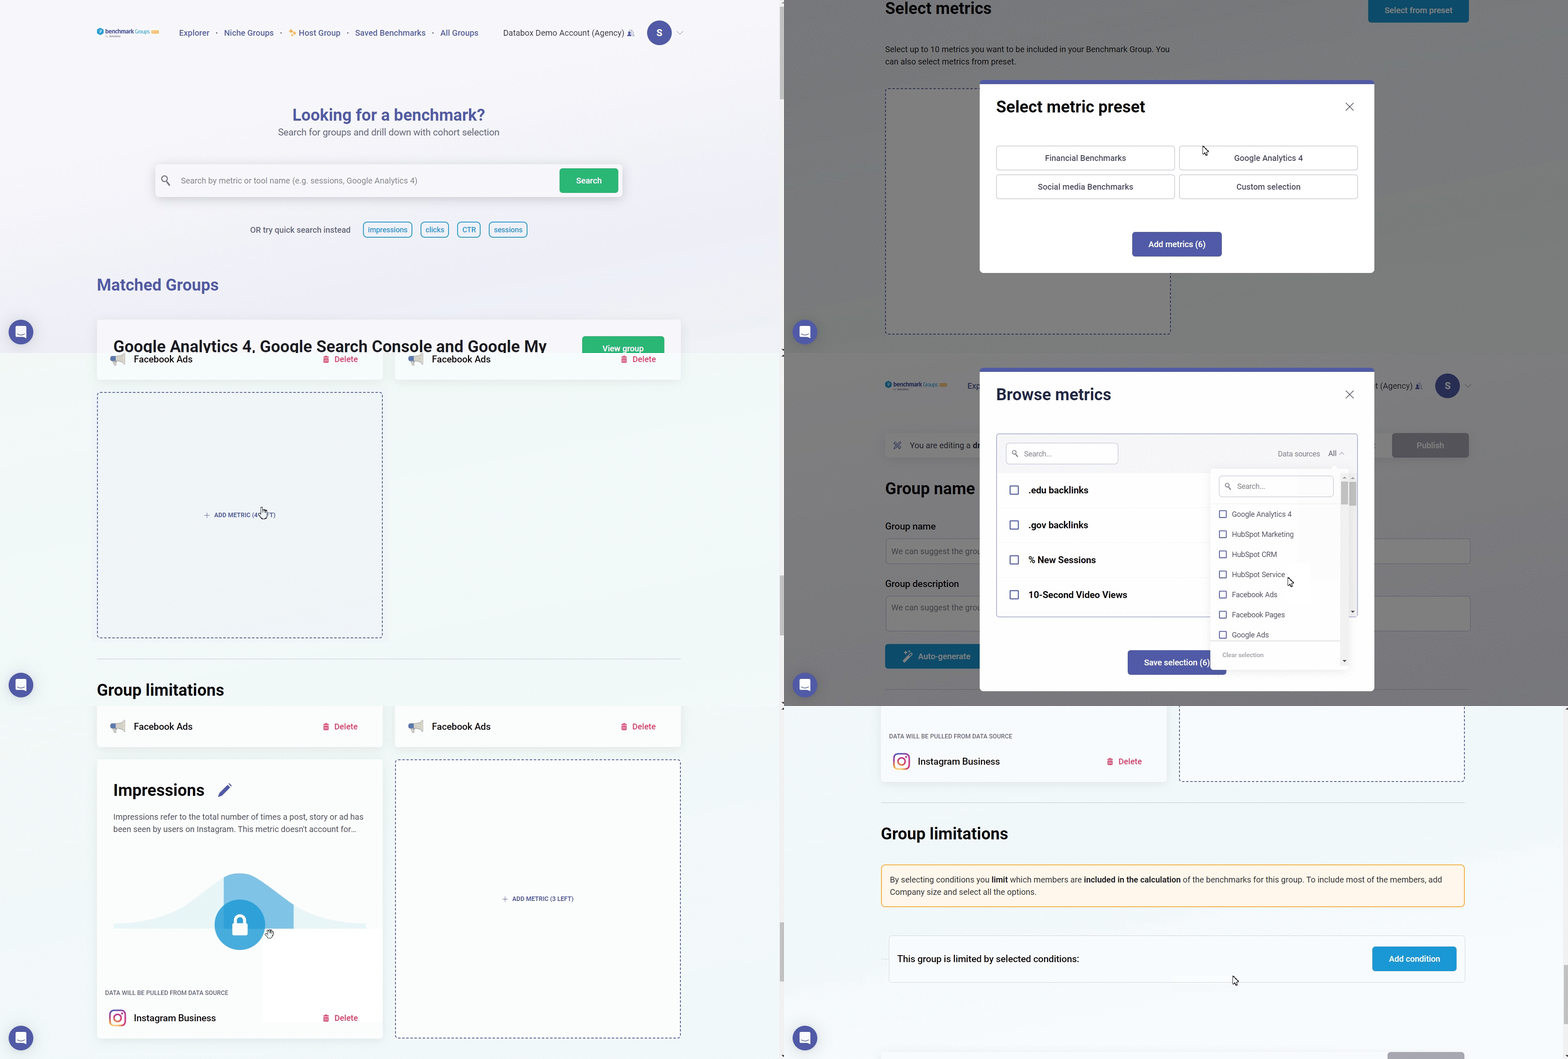
2. Navigate to the Select Metrics section and click on the Select from Preset button to select Metrics for your group. You can select any of the  pre-selected sets of Metrics or you can choose  Custom Selection
The three pre-selected sets of Metrics are  Financial BenchmarksSocial Media Benchmarks and Google Analytics 4. These pre-selected sets contain Popular Metrics of Data Sources related to that specific set. 
If you choose Custom Selection, enter the name of a Metric in the  Search bar to find the Metric you're looking for. You can filter out Metrics for a specific Data Source by using the  Data Sources drop-down. 
3. Add more Metrics to your group by clicking on + Add Metric. In this example, we'll select Impressions as the Metric and Instagram Business as the Data Source.

Pro Tip: You can add up to 10 Metrics to your Benchmark Group 

4. Click on the  Save Selection button to save your Metric.
5 Navigate to the  Group name and Group description section at the top of the page and click the  Autogenerate button. This will automatically generate a name and description of your group according to the Metrics and Data Sources you have selected.
Our auto-generated group name is " LinkedIn Ads, Facebook Ads and Instagram Business Benchmarks" and the Group description is " Gain insights into your metrics such as Impressions, Clicks, Spent, Amount Spent, Impressions, Link Clicks and Impressions".

Pro Tip: You can click on your Group name and Group description to edit them. 

 6. In the Group Limitations section, click Add Condition to select conditions to define your group. You can define your group by the Business type , Company size, Industry, and/ or  Revenue. Click Save Selection to save the group limitation parameters. We'll select the Company size and  select all.

Pro Tip: You have to select at least 1 limitation for your group. By selecting conditions you  limit which members are included in the calculation of the benchmarks for this group. To include most of the members, choose Company size and select all.

7. Next, click on the green Publish button. 

Pro Tip: The  benchmarks will be calculated only if your group has enough members to meet the group criteria and if their Data Sources have data for the last month.


How to invite Members to your Invite-Only Group

Pro Tip: Only the group owners will be able to invite members to their invite-only group (private group).

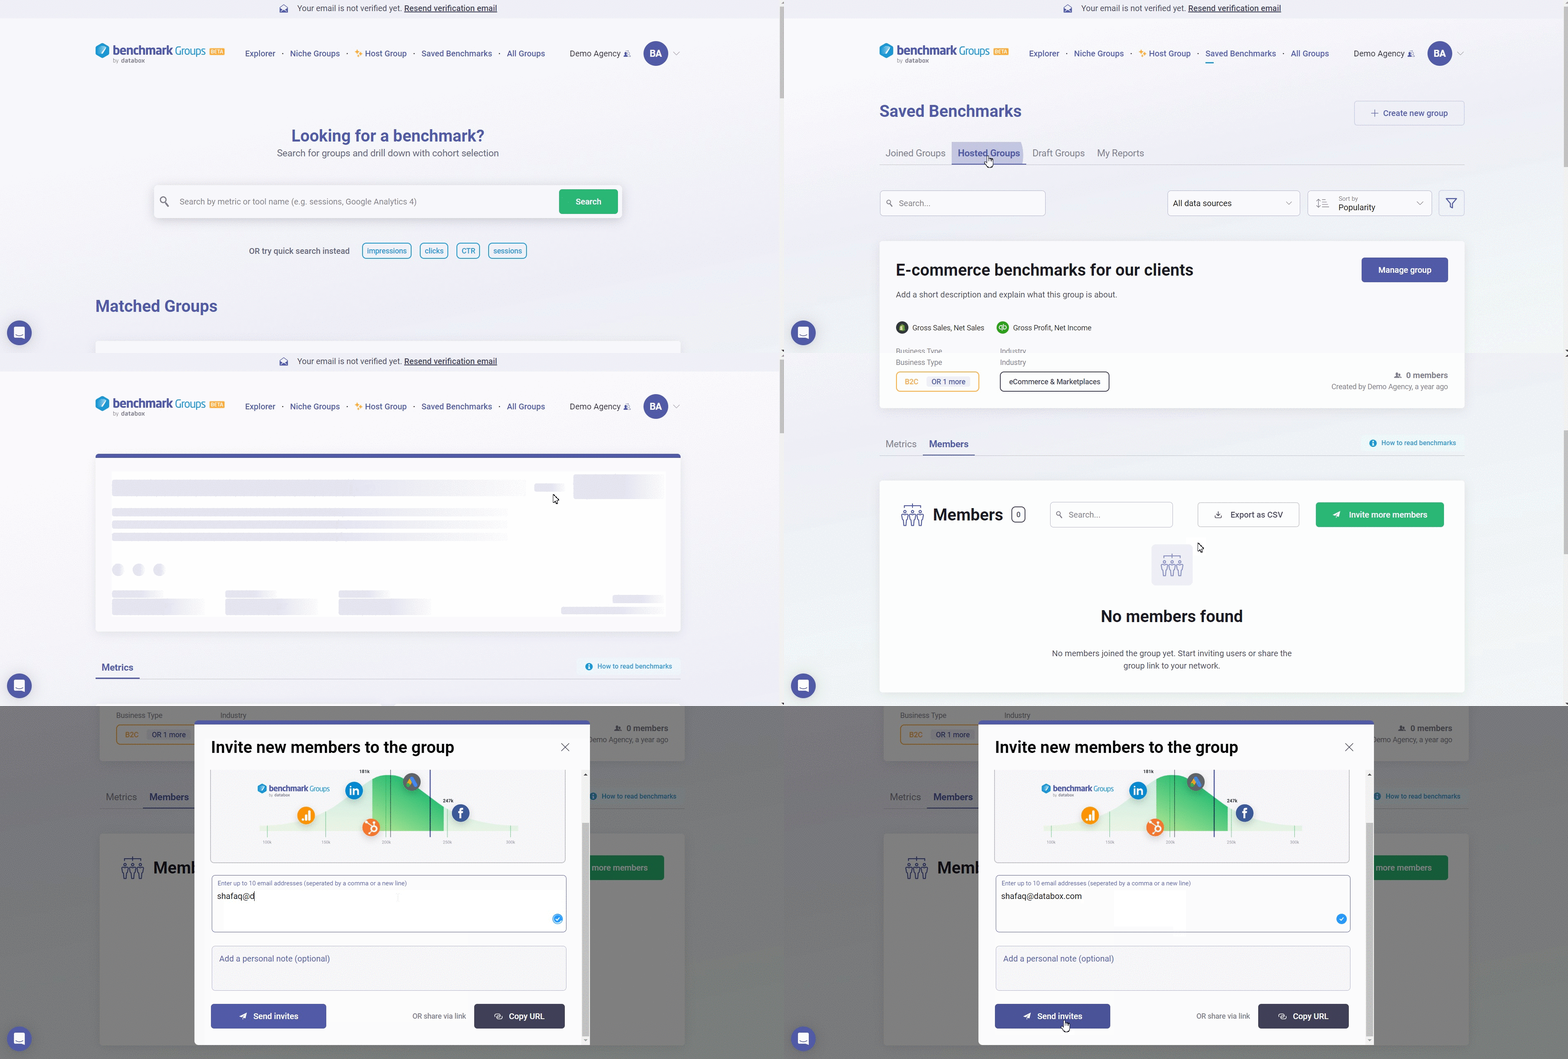
  1. Navigate to My Groups.
  2. Next, navigate to the group you want to manage and click on blue Manage Group button.
  3. Click on the  Members tab.
  4. Click on the green Invite more members button.
  5. Enter the Email addresses of the members you want to add. You can send a personal note with your email by clicking on Add personal note to email.
  6. Click on the blue Send invites button.

How to manage Members of your Invite-Only Group

Pro Tip: The Group's owner and users in owner's Databox Account with sufficient permissions (i.e. Admins and Editors) will be able to see and manage the group members.

  1. Navigate to My Groups.
  2. Next, navigate to the group you want to manage and click on blue Manage Group button.
  3. Click on the  Members tab.
  4. Hover over the  Member you want to delete and click on the Settings icon in the right-hand side.
  5. Click Remove to remove the member from the group. 

Pro Tip: When a member is removed from the group, it will appear below in the  Member removed section. You can restore the member to the group by hovering over the Member  > click on  Settings icon Restore Member.


How to use Benchmark Groups for your Clients

THIS SECTION

How to quickly update Company Information for your Clients

Company such as industry, business type, company size, and revenue is necessary for your to be able to join Benchmark Groups. By adding this information for your clients, you'll be able to add them to more relevant Benchmark Groups and benchmark their performance against similar companies. Learn more on how to update your Company Information and your Clients Company Information here

Only Agency Accounts have access to Client Accounts. Learn more about how to become a Databox Agency Partner here

Follow the steps below to quickly update Company Information for your Clients:

  1. Open your Databox Analytics Account and navigate to the Clients page.
  2. Click  Join Benchmarks for your preferred Client Account. This will open a window where you can fill in your Client's Company Information such as Industry, Business Type, Number of Employees and Annual Revenue
  3. At the top of the window, you can click the arrow to navigate between Client Accounts and update Company Information for additional clients.
  4. Next, click on the green  Save and Accept button to save your Clients Company Information. 

How to switch between your Agency and Client Accounts

Only Agency Accounts have access to Client Accounts. Learn more about how to become a Databox Agency Partner here

Pro Tip:  Client Accounts created in the Databox app will also be visible in the Benchmark Groups. Learn more here.

  1. From any page in Benchmark Groups, click on the  Switch Accounts icon on the top right-hand side.
  2. Select the Client Account from the available Client Account drop-down list to switch to the preferred Client Account.

How to join your Invite-only Group on your Clients behalf

Only Agency Accounts have access to Client Accounts. Learn more about how to become a Databox Agency Partner here

Pro Tip: Client Accounts created in the Databox app will also be visible in the Benchmark Groups. Learn more here.

1. After you have created a Benchmark Goup in your Agency Account, switch to your Client Account to add them to your invite-only group. Click on the  Switch Accounts icon on the top right-hand side and select the preferred Client Account from the available Client Account list to switch to that Client Account.
2. Navigate to Agency Groups and click on the green View Group button.
3. Click on the blue  + Join group button to add your Client to your Group. This will open a new window where you will be prompted to select or connect your client's Data Source(s).
4. If the Data Source is already connected in your Client Account, click on the drop-down arrow to select the Data Source.

If the Data Source is not already connected in your Client's Account, click on the green Connect button to connect your client's Data Source(s). An Authorization window will open where you will be prompted to enter your client's login credentials for that specific Data Source.

5. After you have connected the Data Source(s), click the blue Continue button so your Client is added to your Invite-Only Group.

How to join a Benchmark Group on your Clients behalf

Only Agency Accounts have access to Client Accounts. Learn more about how to become a Databox Agency Partner here

Pro Tip: Client Accounts created in the Databox app will also be visible in the Benchmark Groups. Learn more here.

  1. Click on the  Switch Accounts icon on the top right-hand side and select the preferred Client Account from the available Client Account list to switch to that Client Account.
  2. Navigate to All Group and click on the green View Group button.
  3. Click on the blue  + Join group button to add your Client to the Benchmark Group. This will open a new window where you will be prompted to select or connect your client's Data Source(s).
  4. If the Data Source is already connected in your Client Account, click on the drop-down arrow to select the Data Source.If the Data Source is not already connected in your Client's Account, click on the green  Connect button to connect your client's Data Source(s). An Authorization window will open where you will be prompted to enter your client's  login credentials for that specific Data Source.
  5. After you have connected the Data Sources, click the blue  Continue button so your Client is added to the Benchmark Group.

How to view Benchmarks

Pro Tip: Learn how data is being calculated for Benchmarks here.

IN THIS SECTION

How to view Benchmarks

A Benchmark is a set of statistics calculated for a given metric in a benchmark group. You can view the Benchmarks of the group in the Metrics section.
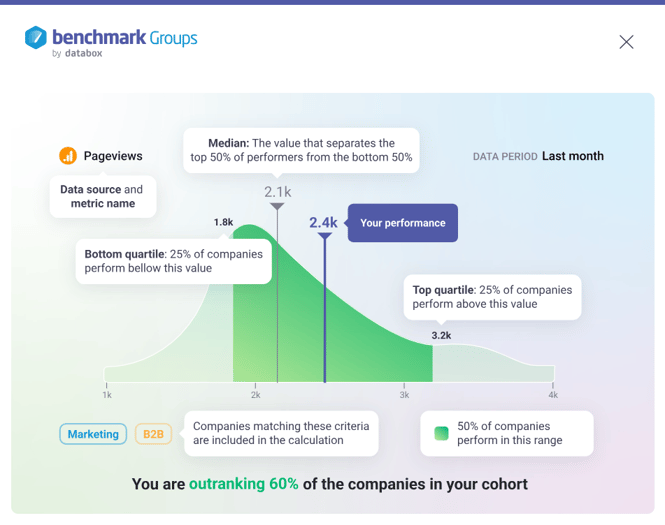
A) Benchmark: Clicking on this will show the Benchmark
B) Metric name: The name of the Metric for this Benchmark.
C) Data Source: The Data Source connected for this Benchmark.
D) Visualization type: Click on the icons to switch between the two Visualization types (Hill Chart and Bar Line) for the Benchmark. Learn more about Visualization types here
E) Date Range: The date range for this Benchmark for e.g Last month which will show data from the first day of the previous month to last day of the previous month
F) Share: The  Share button will open a pop-up window, where you can enable the "Include numbers" toggle if you want the numbers to be displayed on the Benchmark you've chosen to share.You can enable the "Show my results" toggle if you want your results to be displayed on you the Benchmark you've chosen to share. You can share the Benchmark on Twitter, LinkedIn or you can share it via a link. 


How to view Benchmarks on a Timeline

A Benchmark Timeline will show you benchmark data for the last 3 months, last 6 months, and last year on a time series chart. You can view the Benchmark Timeline for a Metric in the Metrics section.


A) Timeline: Click on this icon to view the Benchmark Timeline
B) Metric name: The name of the Metric displayed on the Benchmark Timeline
C) Data Source: The Data Source Connection used for the Benchmark Timeline
D) Date Range: Select the date range for this Benchmark Timeline from the drop-down list. You can select Last 3 Months, Last 6 Months, or Last Year.

Pro Tip: Currently we only show data from October 2022 onwards.

E) Your Benchmark: Click on this text to highlight how you're performing on your Benchmark Timeline. 
F) Median: Click on this text to highlight the Median performance of the group on the Benchmark Timeline. The Median is the value lying at the midpoint of frequency distribution of data. 
G) 1 st quartile (also known as the Bottom Quartile): Click on this text to see the bottom quartile of the groups performance on the Benchmark Timeline. 25% of all values are smaller than the 1st quartile.
H) 3rd quartile (also known as the Top Quartile): Click on this text to see the top quartile of the groups performance on the Benchmark Timeline. 75% of all values are smaller than the 3rd quartile.


How to view Benchmark Details

Benchmark Details give you more detailed information about the data displayed. They allow you to view the description of the metric, the median value of the group, the number of data source contributors, the date range and the time when the benchmark was last updated. You can view the Benchmark Details of the Metric by selecting Details in the Metrics section.


How to view Benchmarks in Joined Groups

Pro Tip: When you join an invite-only group (private group), groups owners won't be able to see the data of any specific group member. They can only see the group Benchmarks when they are calculated. 

Group members can see the benchmark of a metric in the groups they have joined. These visualizations are in red or green.

  • Median is the value lying at the midpoint of a frequency distribution of data.

  • Red is displayed when your value is below the Median.

  • Green is displayed when your value is above the Median.


How to view Benchmarks in My Groups

A group owner can see the benchmark for a metric if there is enough contributor data to calculate Benchmarks. These visualizations are displayed in blue and do not include the group owner's data. Instead, they show the distribution of the benchmark data in that specific group. 

  • Median is the value lying at the midpoint of a frequency distribution of data.

  • The light blue color represents the data outside the 1st (bottom) and 3rd (top) quartile
  • The dark blue color indicates the beginning of the 1st (bottom) quartile and the end of the 3rd (top) quartile.

A group owner can see the median performance of the group as well as the top and bottom quartiles of the groups performance on the Benchmark Timeline.


How to manage your Data Sources

All data management actions made in Benchmark Groups will be reflected in your Databox Analytics Account as well (e.g. adding, reconnecting and deleting a Data Source, etc.).

IN THIS SECTION


How to access Data Management

Benchmark Groups users can connect up to 3 Data Sources under the free Databox Plan. To connect more Data Sources, upgrade your Databox plan here.

  1. Navigate to the Account > Data Management
  2. Hover over the Data Source you want to manage and click on the Settings icon
  3. You can choose between the options  Edit data sourceEdit data source metadata, or  Delete data source


How to edit Data Source

When you select  Edit Data Source from the drop-down you'll be able to see the Data Source details. 

Here you can view the Data Source that is connected, the status of the connection, the time zone and who has access to this Data Source (in the Databox app). You can also rename the Data Source connection by clicking on the Data Source name, or delete it. 

If you delete a Data Source from your Benchmark Groups Account, your Data Source will be deleted from your Databox Analytics Account as well. 


How to edit Data Source Metadata

We use this Metadata information to match the company to the characteristics of the benchmark group you are trying to join. If the company information and group conditions (company size, annual revenue, business type or industry) don’t match, your data from this respective Data Source won’t be included in the calculations

When you select Edit Data Source Metadata from the drop-down you'll be able to see the Data Source Metadata details. 

A) Apply metadata information from company: This option fills the fields with your company data, inherited from the metadata set for the account.
B) Define metadata for this Data Source: This option allows you to change the information of your company so you can match the criteria of a benchmark group you want to join. As Agencies can connect Data Sources for their clients, you can select this option to change the company data for a specific Data Source, so you can use the client’s company information if it matches the group.


How to delete Data Source


To delete your Data Source, select  Delete data source from the drop-down and confirm it by clicking the red Yes, delete button.

If you delete a Data Source from your Benchmark Groups Account, your Data Source will be deleted from your Databox Analytics Account as well.