
Availability
Harvest is a popular time-tracking and expense management tool designed to help individuals, teams, and businesses track work hours, manage budgets, and streamline invoicing. It enables users to log their time against specific projects or tasks, providing insights into how time is being spent and helping optimize productivity. Harvest also integrates with various project management and communication tools, making it easy to incorporate into existing workflows.
If your credentials don't include full access to the data source, make sure your access level meets any permission requirements listed in the Specification section of the integration's page in the Metric Library.
To connect Harvest to your Databox account for the first time or with new credentials, log in using your email address, Google account, or SSO provider.
If you've already established a connection, you can reuse it to add new accounts, as long as those accounts are accessible with the existing connection's credentials.
Choose the Harvest account you want to report on.
The Harvest integration allows you to create custom metrics using the metric builder, ideal for visualizing data not included in the basic metrics offered by the integration.
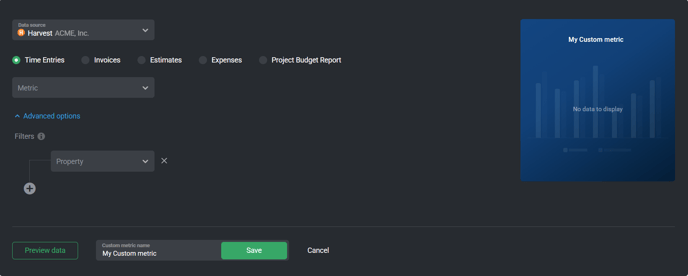
To create a custom metric, start by selecting a metric from the "Metric" selector. Next, customize your metric by optionally adding a dimension and applying one or more filters. The available options depend on the selected entity and data type (e.g., number, text, etc.).
The entities accessible for metric creation are listed below.
Time Entries are records of hours logged by users for specific tasks and projects, either manually or through built-in timers. From this data, teams can gain insights into employee productivity, project progress, billable vs. non-billable time distribution, and time allocation across different tasks or clients.
 In Harvest: Go to the Time section.
Invoices are generated to bill clients based on tracked time, expenses, or fixed project fees, ensuring accurate and professional billing. By analyzing invoice data, businesses can track revenue trends, identify late payments, assess client profitability, and measure the efficiency of their billing cycles.
In Harvest: Navigate to the Invoices section.
Estimates are cost breakdowns sent to clients before a project begins, providing clarity on pricing and scope. Reviewing estimates data helps businesses evaluate pricing accuracy, track conversion rates from estimates to projects, and identify discrepancies between initial projections and final invoiced amounts.
In Harvest: Visit the Estimates section.
Expenses allow users to log and categorize project-related costs, such as travel, materials, and software. Analyzing expense data provides insights into spending patterns, project profitability, budget adherence, and areas where cost-saving measures can be implemented.
In Harvest: Go to the Expenses section.
The Project Budget Report tracks a project's financial health by comparing actual time and expenses against the set budget. This report helps teams monitor budget consumption, identify potential overruns, analyze profitability, and optimize resource allocation for future projects.
In Harvest: Go to Projects > select a project > Budget tab.

The Harvest integration supports the creation of datasets, which allow you to structure and format your Harvest data for more flexible reporting in Databox. By organizing your data into a tabular format, datasets make it easier to filter, segment, and visualize key metrics across projects, clients, and team members.
The entity relationship diagram (ERD) below illustrates how data is organized within the Harvest integration, displaying the available views and columns, as well as the relationships between them (primary and foreign keys). This diagram represents the schema, or structure, of the data and helps you understand the underlying data model. With this context, you can create datasets using the relevant views and columns to build custom metrics tailored to your reporting needs.
For comprehensive details on metrics, data availability, templates, specifications, usage guidelines, and other key information, refer to the resources listed below.


FAQ
Why are certain entities or properties unavailable in the metric builder?
The metric builder pulls raw and analytics data from Harvest's APIs. If an entity or property is missing, it is likely due to limited API support or technical implementation restrictions. If there's something you'd like to see included, feel free to submit a request, so we can consider it for future updates to the integration.


