
ClickUp is a project management and productivity platform designed to help teams plan, organize, and track work in one place. It combines task management, goal tracking, document sharing, and team communication to streamline collaboration and improve visibility across projects. With customizable views and automation features, ClickUp helps teams increase efficiency and stay aligned on priorities.
If your credentials don't include full access to the data source, make sure your access level meets any permission requirements listed in the Specification section of the integration's page in the Metric Library.
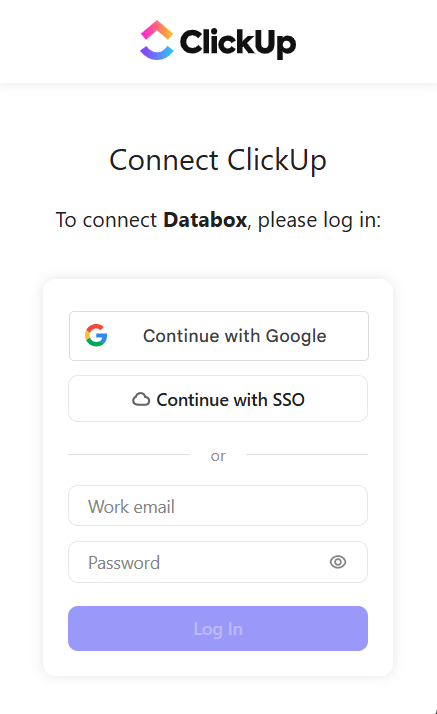
To connect Harvest to your Databox account for the first time, or when using new credentials, log in using your email address, Google account, or SSO provider.
If you've already established a connection, you can reuse it to add new accounts, as long as those accounts are accessible with the existing connection's credentials.
Choose the ClickUp workspace you want to report on. If you have only one workspace, it will be selected automatically.

The ClickUp integration supports the creation of datasets, which allow you to structure and format your ClickUp data for more flexible reporting in Databox. By organizing your data into a tabular format, datasets make it easier to filter, segment, and visualize key metrics across projects, clients, and team members.
The entity relationship diagram (ERD) below illustrates how data is organized within the ClickUp integration, displaying the available views and columns, as well as the relationships between them (primary and foreign keys). This diagram represents the schema, or structure, of the data and helps you understand the underlying data model. With this context, you can create datasets using the relevant views and columns to build custom metrics tailored to your reporting needs.
For comprehensive details on metrics, data availability, templates, specifications, usage guidelines, and other key information, refer to the resources listed below.


FAQ
Why are certain views or columns unavailable when creating a dataset?
Databox retrieves raw data directly from ClickUp's APIs. If a view or column is missing, it is likely due to limited API support or technical implementation restrictions. If there's something you'd like to see included, feel free to submit a request, so we can consider it for future updates to the integration.


