How to view Benchmarks
A Benchmark is a set of statistics calculated for a given metric in a benchmark group.
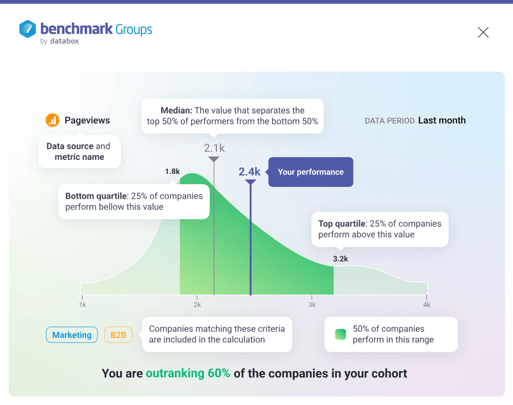
Pro Tip: Learn how data is being calculated for Benchmarks here.
HOW TO
- Access Benchmarks
- View Benchmarks
- View Benchmarks on a Timeline
- View Benchmark Details
- View Benchmarks in Joined Groups
- View Benchmarks in your Hosted Groups
How to access Benchmarks
IN THIS SECTION
How to access Benchmarks in Joined Groups
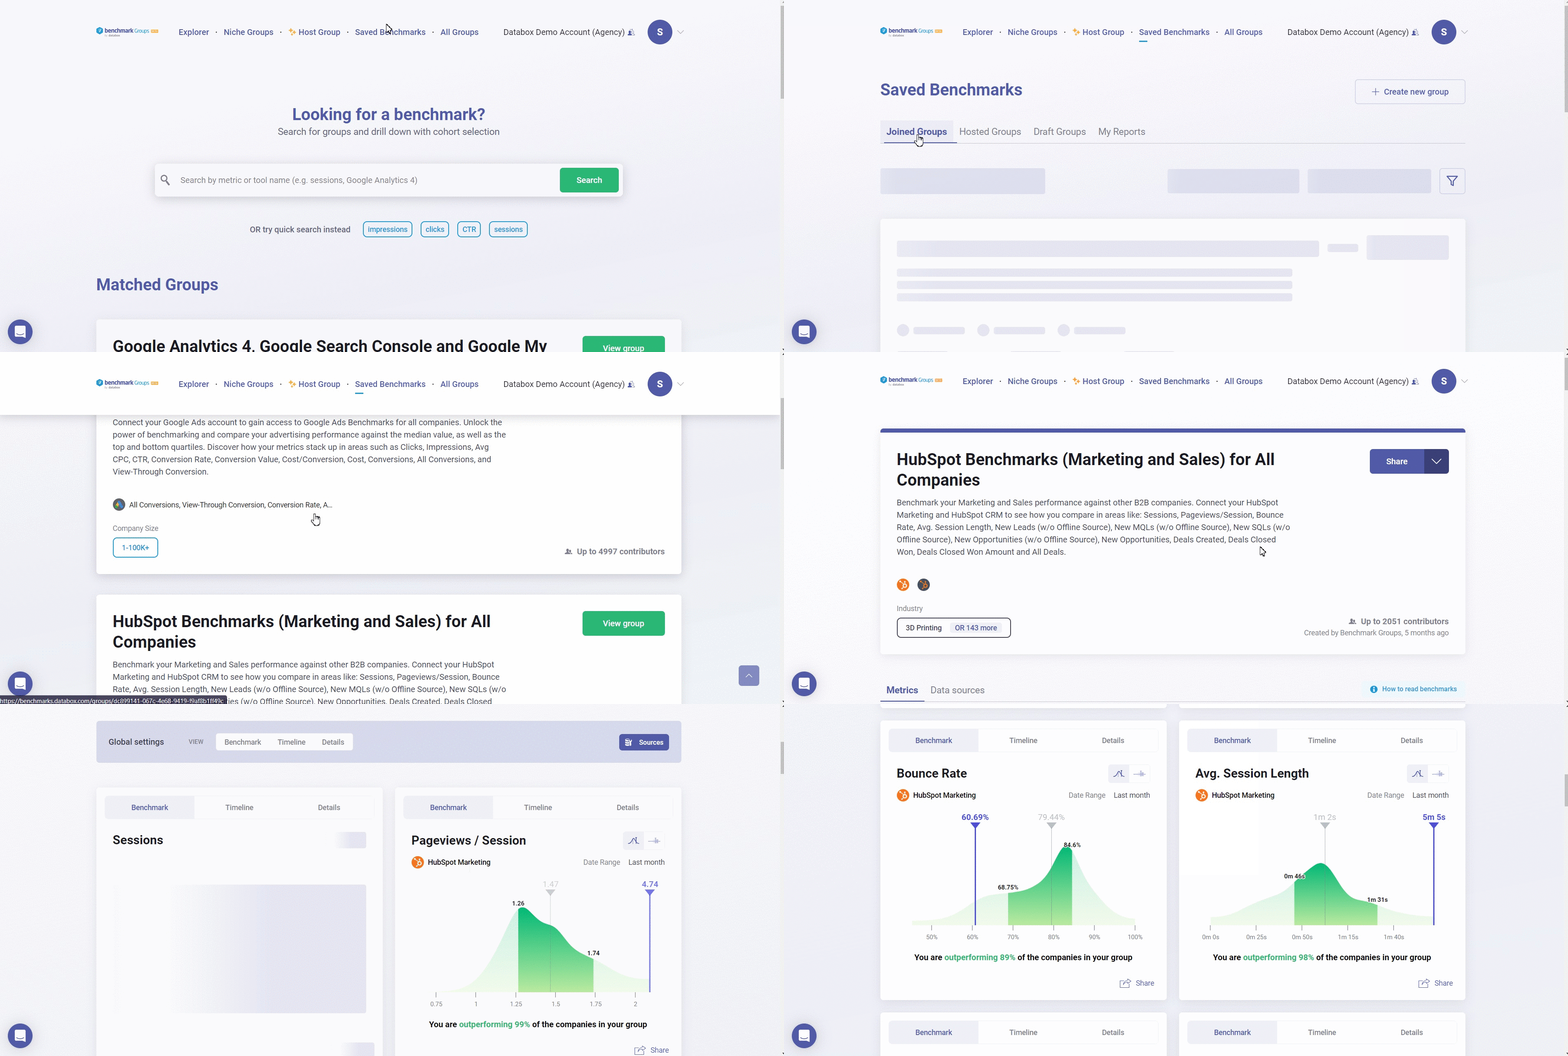
- In your Benchmarks Groups Account, navigate to Saved Benchmarks > Joined Group
- Next, navigate to the group you would like to view the Benchmarks for and click the View group button.
- You can view the Benchmarks of your Joined Group in the Metrics section.
Learn how to view Benchmarks in your Joined Group here.
How to access in your Hosted Groups
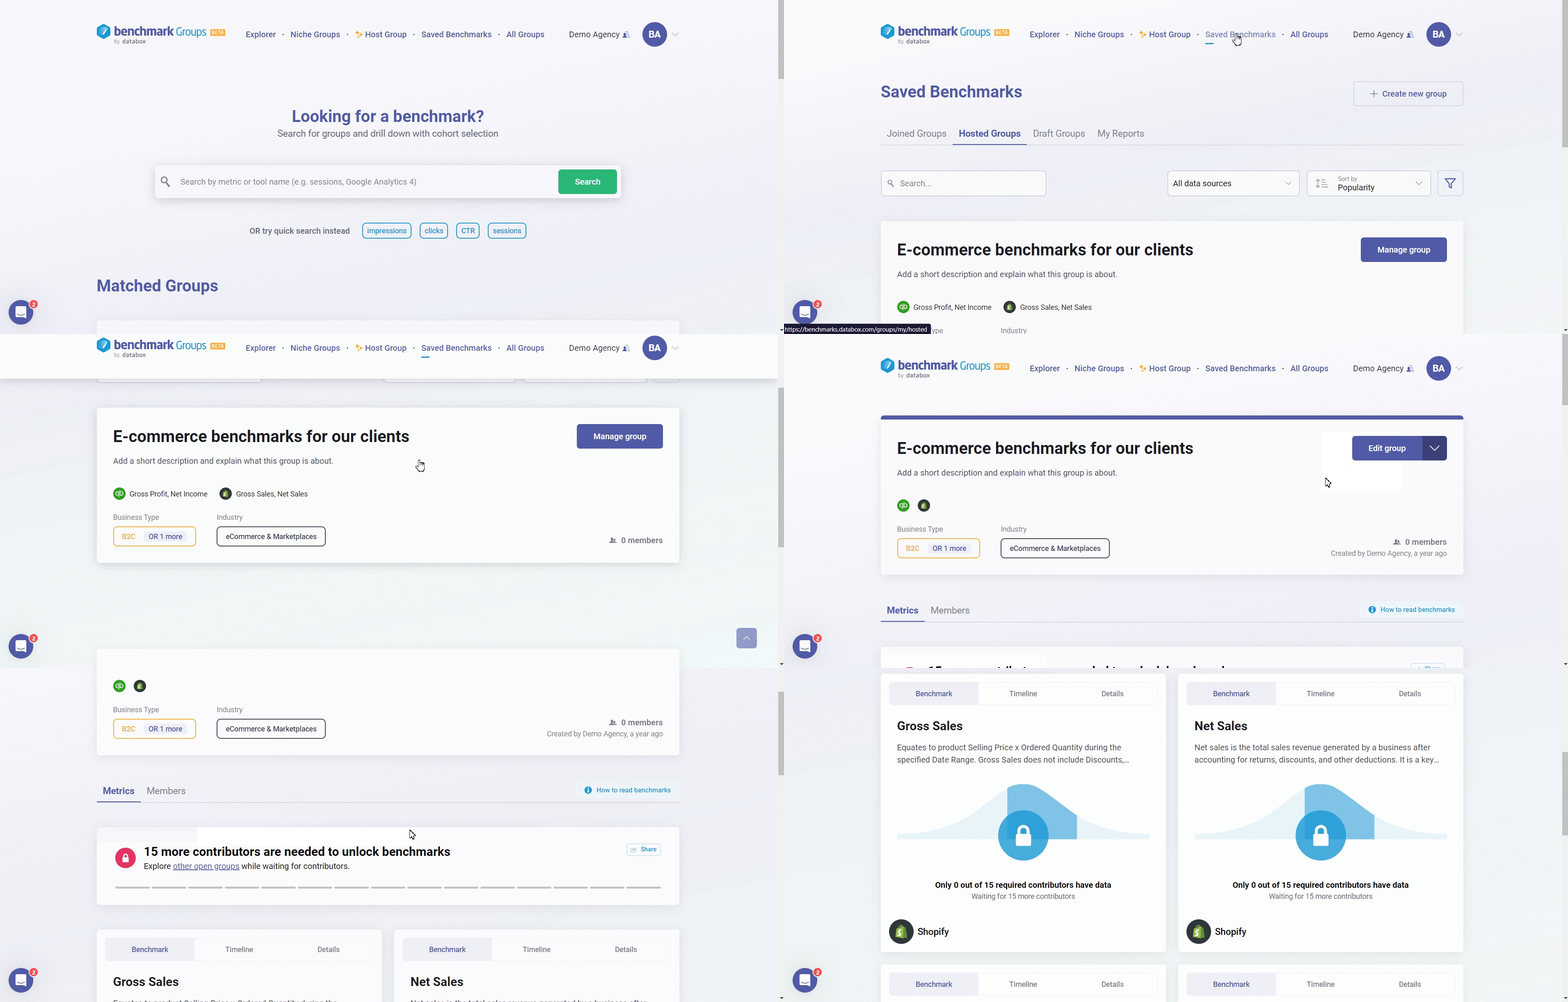
- In your Benchmarks Groups Account, navigate to Saved Benchmarks > Hosted Group
- Next, navigate to the group you would like to view the Benchmarks for and click on the Manage Group button.
- Click on the Members tab.
- You can view the Benchmarks of your Hosted Group in the Metrics section.
Learn how to view Benchmarks in your Hosted Group here.
How to view Benchmarks
You can view the Benchmarks of the group in the Metrics section.
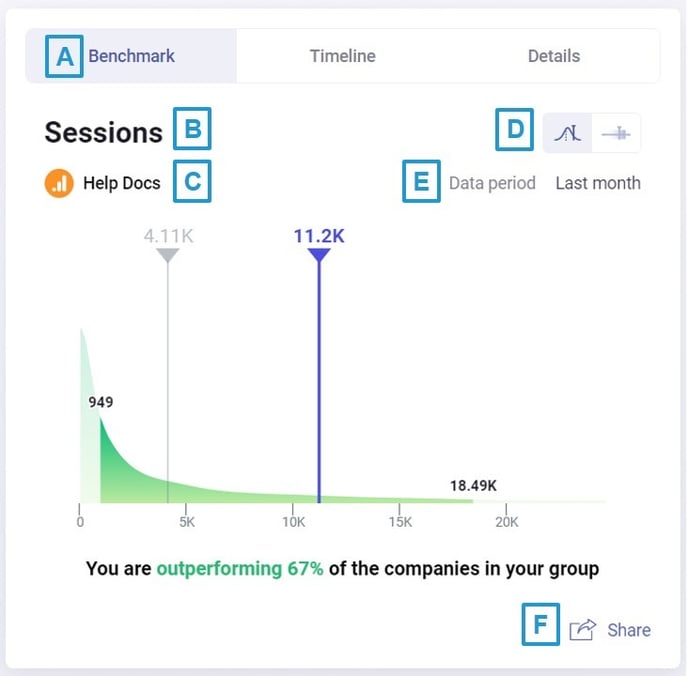
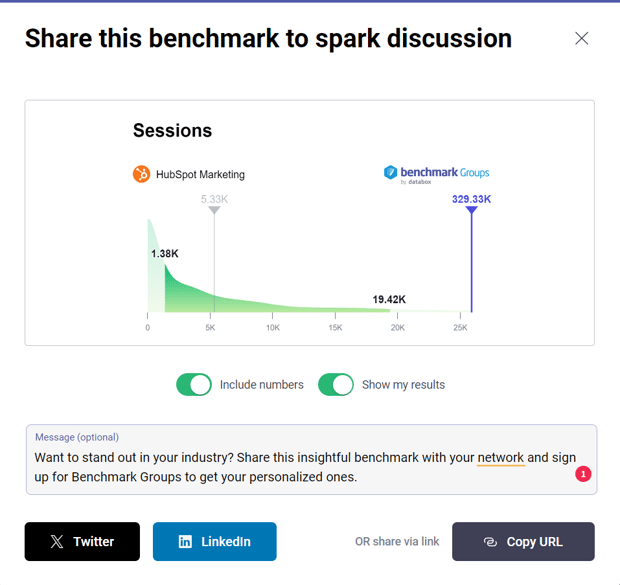
How to view Benchmarks on a Timeline
A Benchmark Timeline will show you benchmark data for the last 3 months, last 6 months, and last year on a time series chart. You can view the Benchmark Timeline for a Metric in the Metrics section.
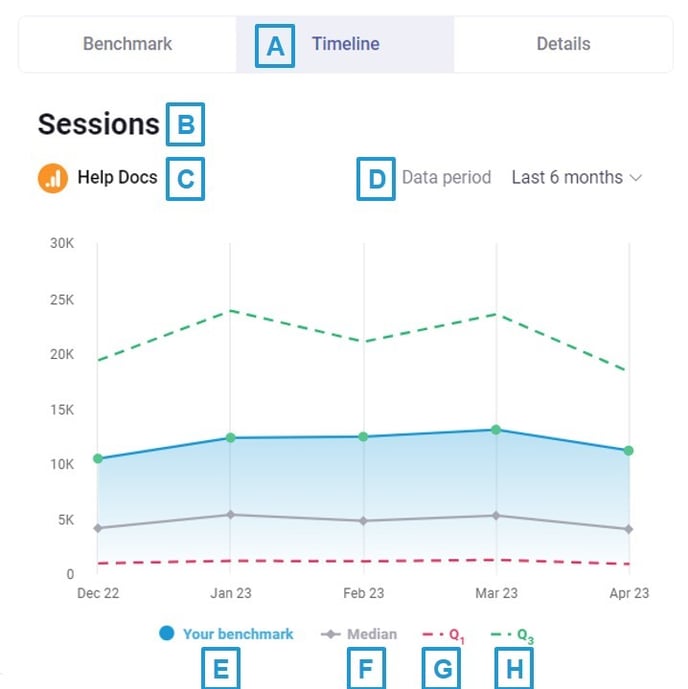
Pro Tip: Currently we only show data from October 2022 onwards.
How to view Benchmark Details
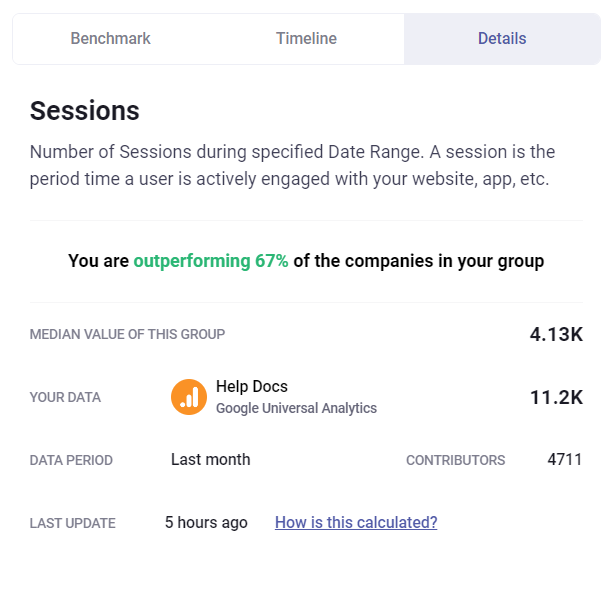
Benchmark Details give you more detailed information about the data displayed. They allow you to view the description of the metric, the median value of the group, the number of data source contributors, the date range and the time when the benchmark was last updated. You can view the Benchmark Details of the Metric by selecting Details in the Metrics section.
How to view Benchmarks in Joined Groups
Pro Tip: When you join an invite-only group (private group), groups owners won't be able to see the data of any specific group member. They can only see the group Benchmarks when they are calculated.
Group members can see the benchmark of a metric in the groups they have joined. These visualizations are in red or green.
- Median is the value lying at the midpoint of a frequency distribution of data.
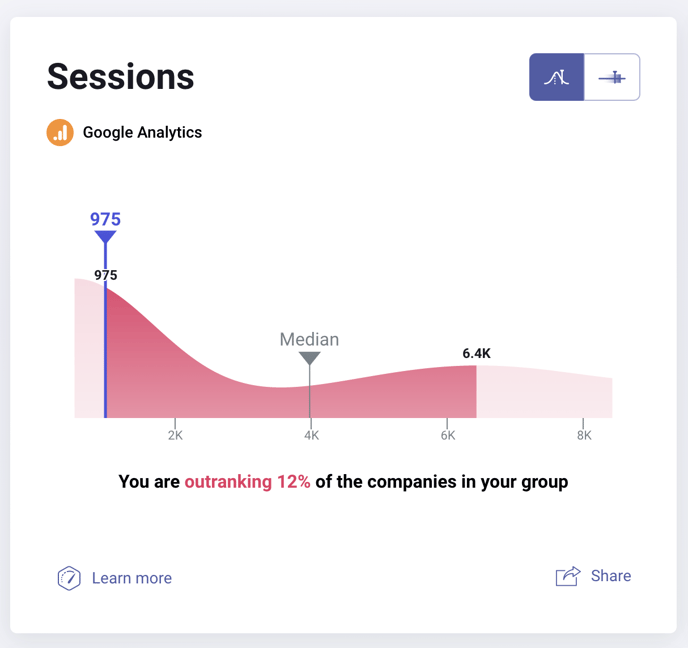
- Red is displayed when your value is below the Median.
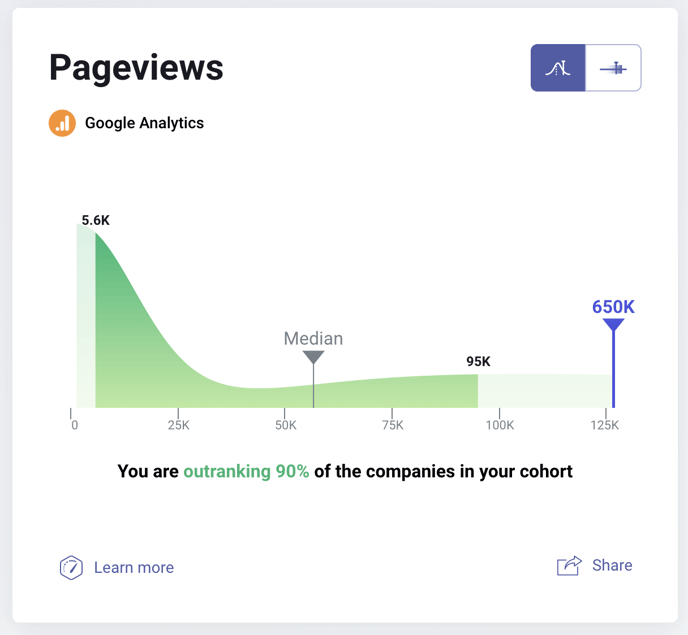
- Green is displayed when your value is above the Median.
How to view Benchmarks in Hosted Groups
A group owner can see the benchmark for a metric if there is enough contributor data to calculate Benchmarks. These visualizations are displayed in blue and do not include the group owner's data. Instead, they show the distribution of the benchmark data in that specific group.
- Median is the value lying at the midpoint of a frequency distribution of data.
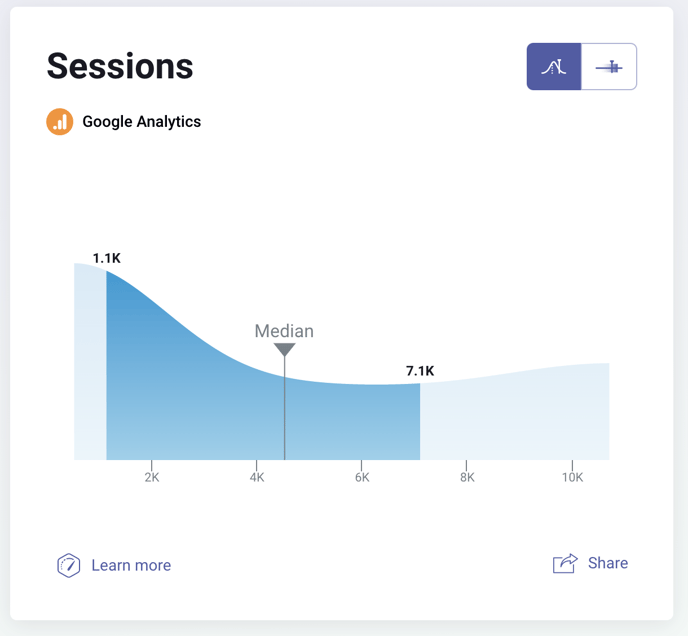
- The light blue color represents the data outside the 1st (bottom) and 3rd (top) quartile
- The dark blue color indicates the beginning of the 1st (bottom) quartile and the end of the 3rd (top) quartile.
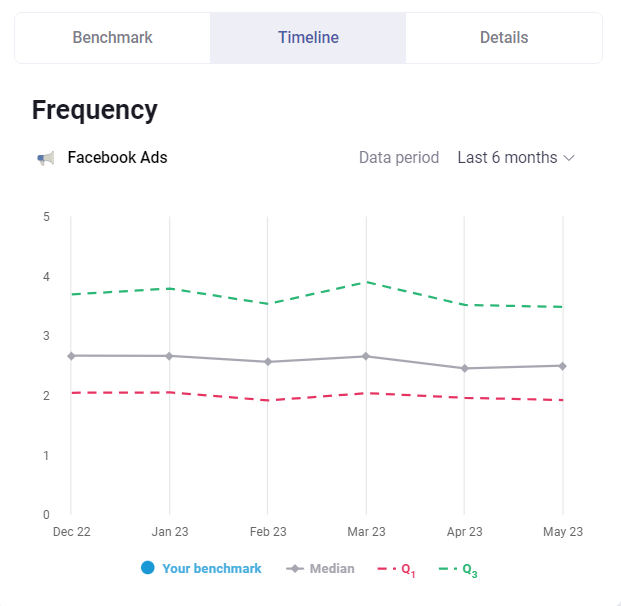
A group owner can see the median performance of the group, as well as the top and bottom quartiles of the group's performance on the Benchmark Timeline.