How to use the Benchmark Explorer
With the Benchmark Explorer, you can search and find hundreds of Marketing, Sales, and Revenue benchmarks in seconds. You can even save the metrics you want to track in a Benchmark Report, and send it to yourself or your team every month.
Pro Tip: You can view hundreds of benchmarks without signing up.
- We close 32 deals/month. Is that good?
- We get 2.3k sessions/month. What do other SaaS companies get?
- Our Cost Per Click is $8.30. Is that high?
Benchmarks can help answer questions like these so you can see where you're ahead of the curve and where there's room for improvement.
IN THIS ARTICLE
- How to create a Benchmark Report [Example]
- How to use Databoard Templates to Improve Performance
- How to edit your Benchmark Report
- How to share your Benchmark Report
- How to delete your Benchmark Report
How to create a Benchmark Report [Example]
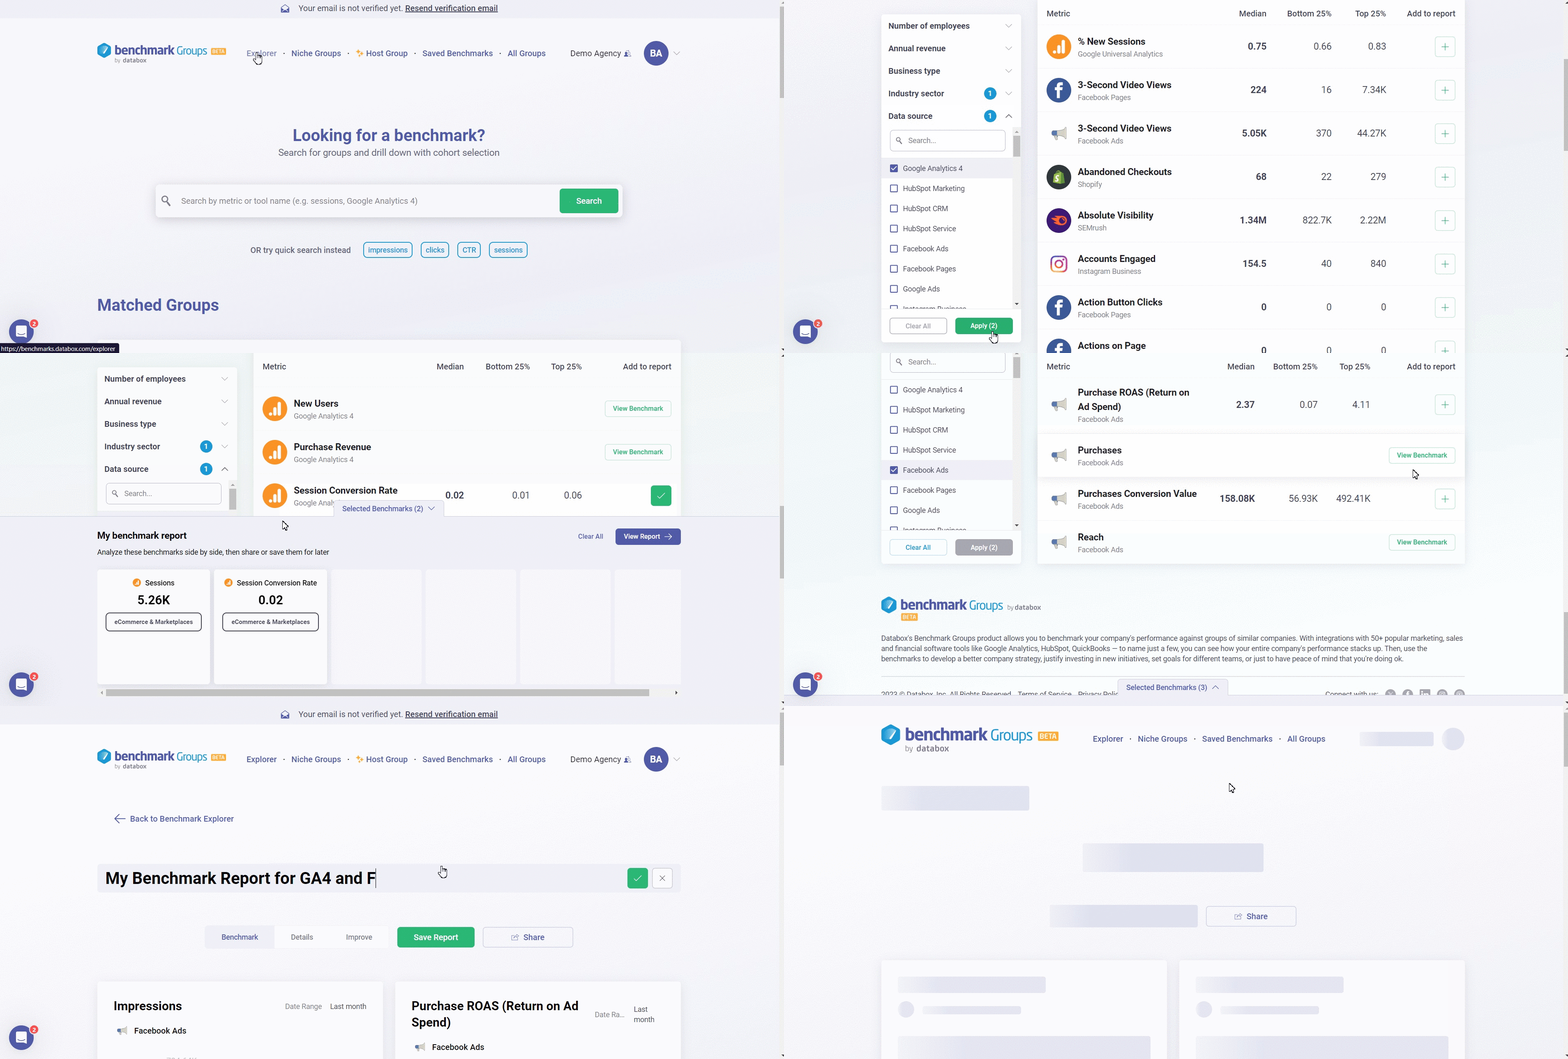
- In the Benchmarks Groups Account, navigate to Explore
- Click on the drop-down arrows on the left-hand side to filter the Metrics by Industry sector, Number of employees, Annual revenue, Business type or Data Source. In this example, we'll select eCommerce & Marketplaces as the Industry sector and Google Analytics 4 and Facebook Ads as the Data Sources.
- Click on the green Apply button to apply your filters.
- Select your Metrics for your Benchmark Report. Navigate to the Metrics you want to add to your Report and click on the + icon. We'll select the Metrics "Sessions" and "Session Conversion Rate" for Google Analytics 4 and the Metrics "Impressions" and
"Purchase ROAS (Return on Ad Spend)" for Facebook Ads.
Pro Tip: You can add up to 6 Metrics to your Benchmark Report.
5. Next, click on the View report button, this will generate your Benchmark Report.
6. You can edit the name of your Benchmark Report by clicking on the pencil icon. After you update the text, click on the checkmark to save the new text, or the X to delete the new text and revert to the original. We will name our report "My Benchmark Report for GA4 and Facebook Ads".
7. You can view details of the Benchmarks by clicking on the Details tab.
8. Click on the green Save Report button to save your Benchmark Report.
How to use Databoard Templates to Improve Performance
Databox offers Public Templates so you can improve your performance by visualizing, analyzing, and gathering key insights from your performance data in just a few clicks.
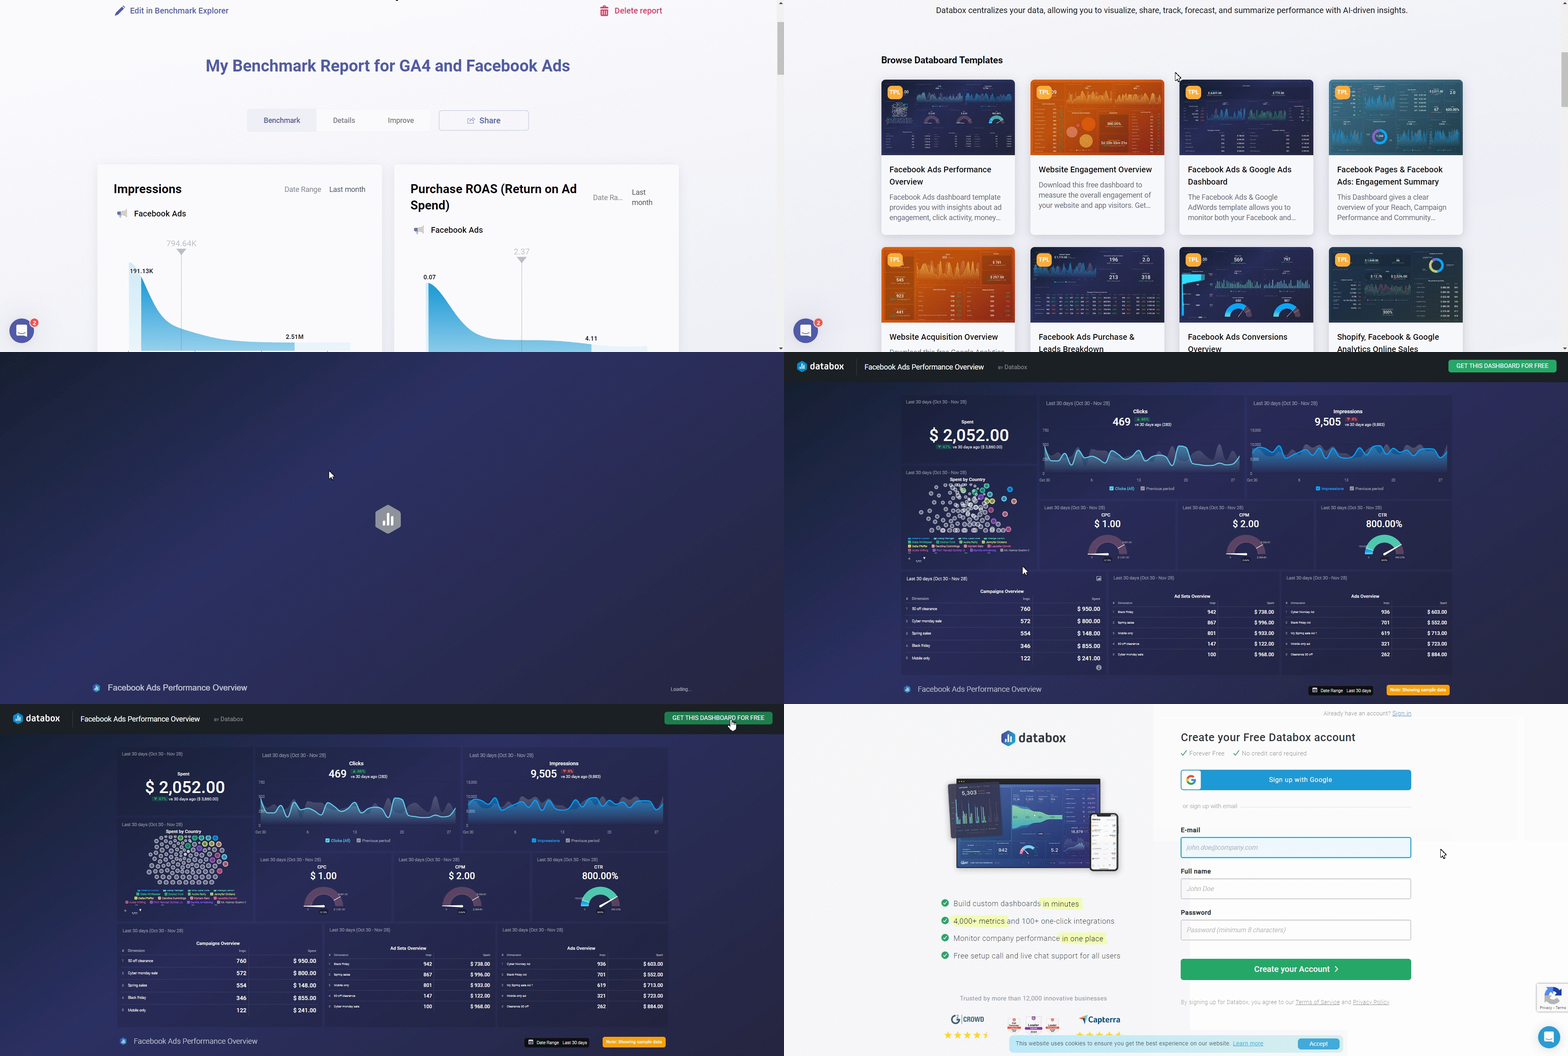
- In your Benchmark Report, click on the Improve Tab. This will open a collection of Databoard Templates of the Data Sources you had selected.
- Hover over a Template and click on the green Preview Template button to view a preview of the Databoard populated with dummy data.
- To use this Template and repopulate it with your own unique data, click on the Get this Dashboard for Free button on the top right-hand side. This will take you to a window where you can create a Databox Account, or you can sign with your Databox credentials if you are already a Databox user.
How to edit your Benchmark Report
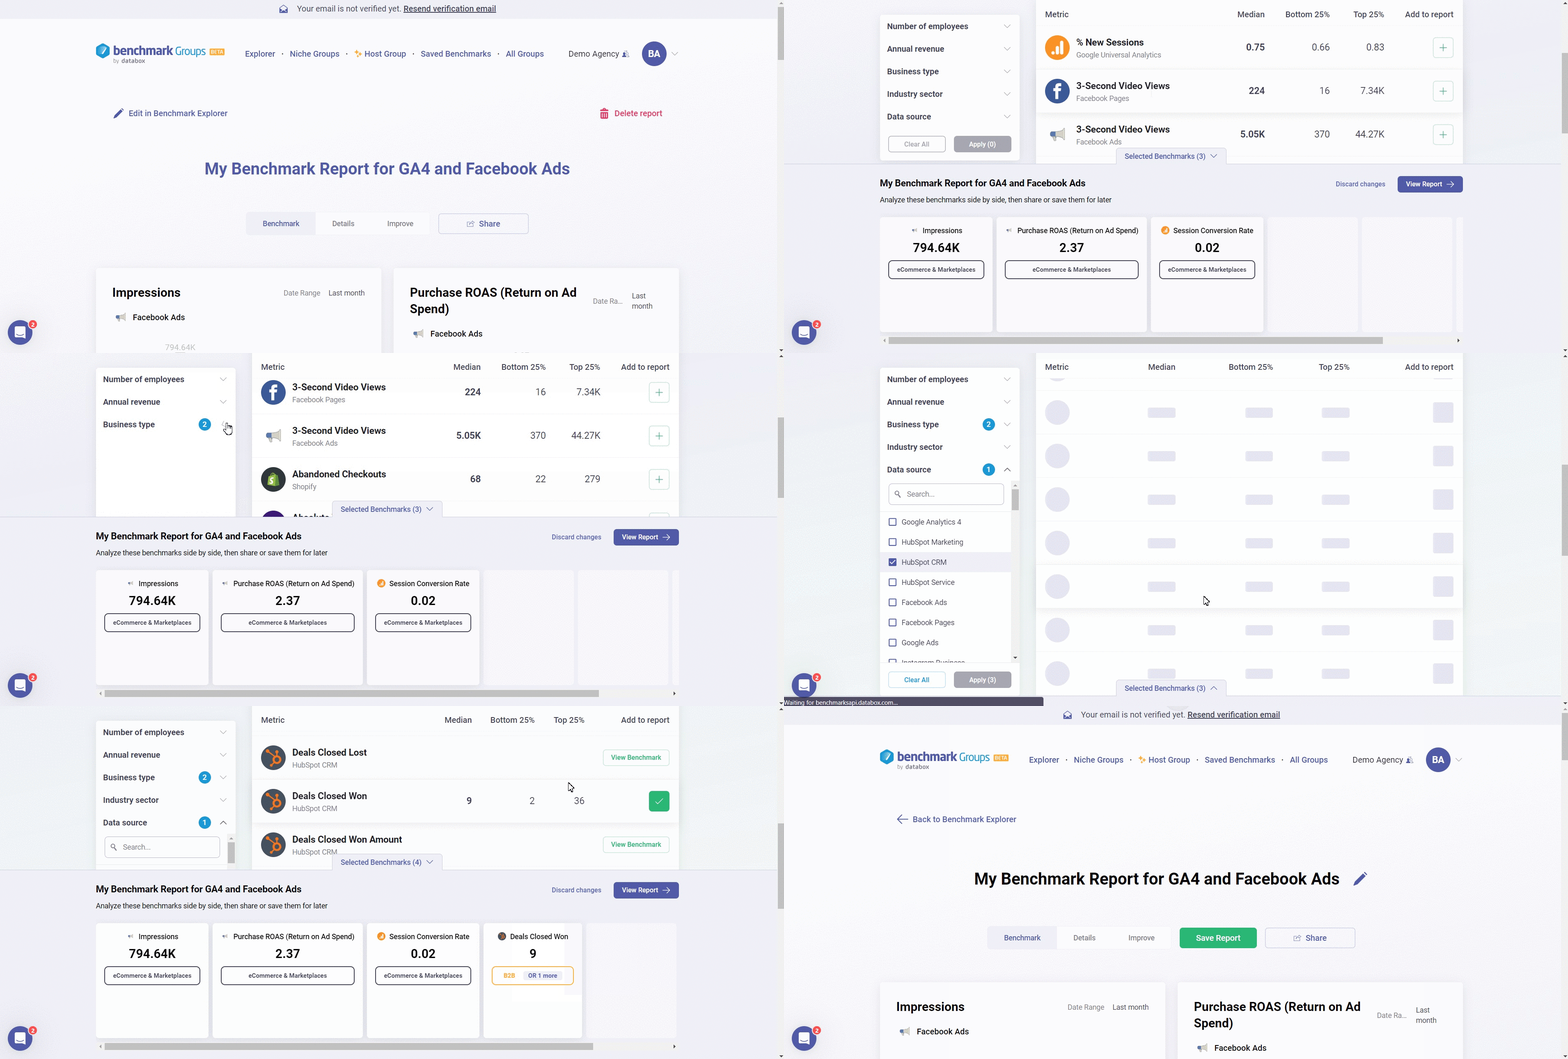
- To edit your Benchmark Report, click on the edit in Benchmark Explorer button on the top left-hand side of your Report. This will open the Benchmark Explorer, where you can update the Metrics of your Report.
- To remove a Metric, hover over it and click on the X icon.
- To add new Metrics, navigate to the Metrics you want to add, and click on the + icon.
- Click on View Report to view your updated Benchmark Report.
How to share your Benchmark Report
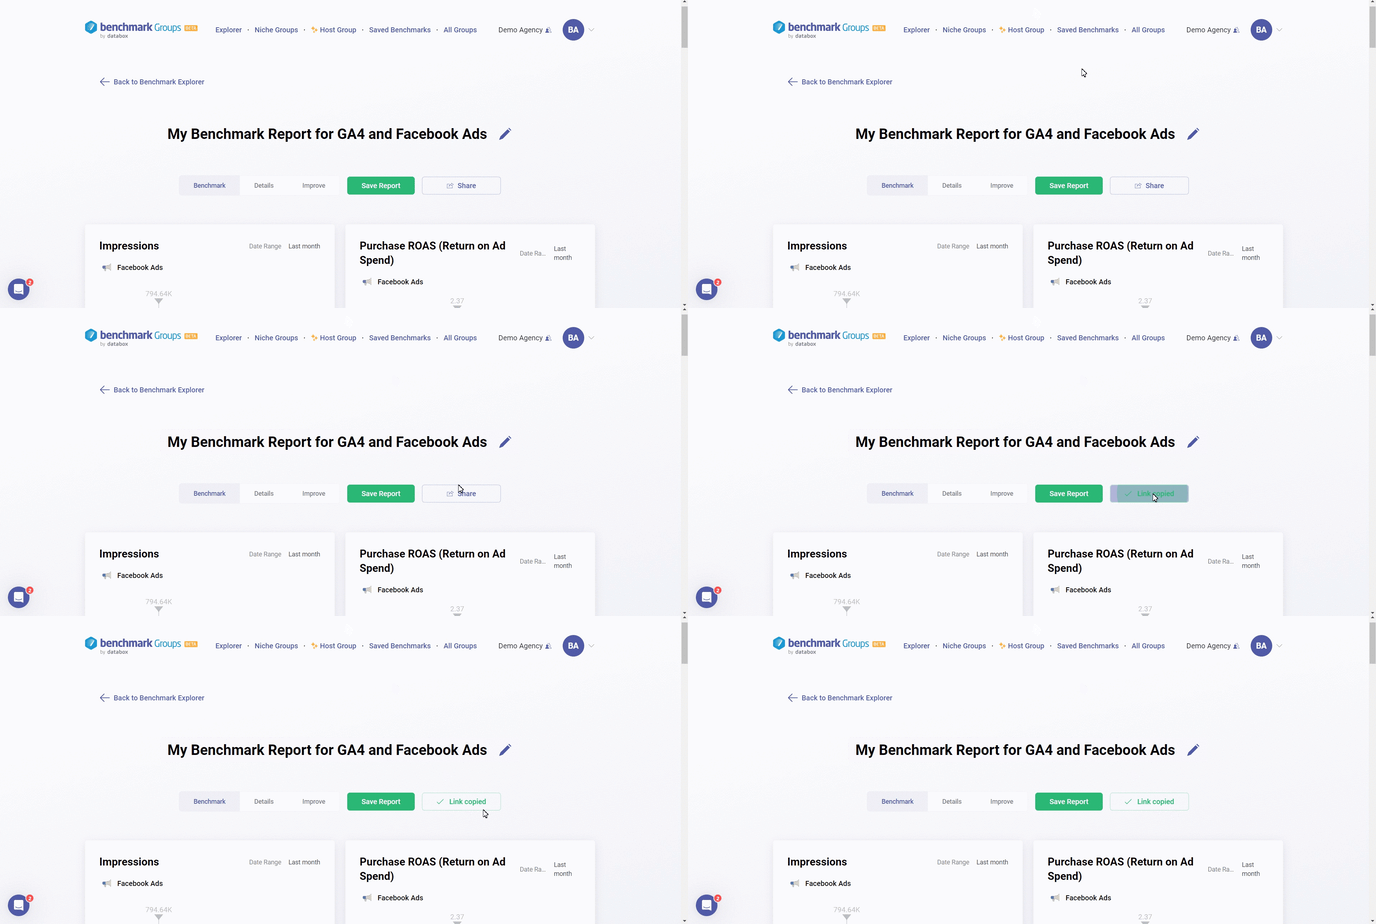
In your Benchmark Report, click on the blue Share button, this will copy the URL of your Benchmark Report. You can paste this URL in an email, slack etc. to share this Report.
How to delete your Benchmark Report
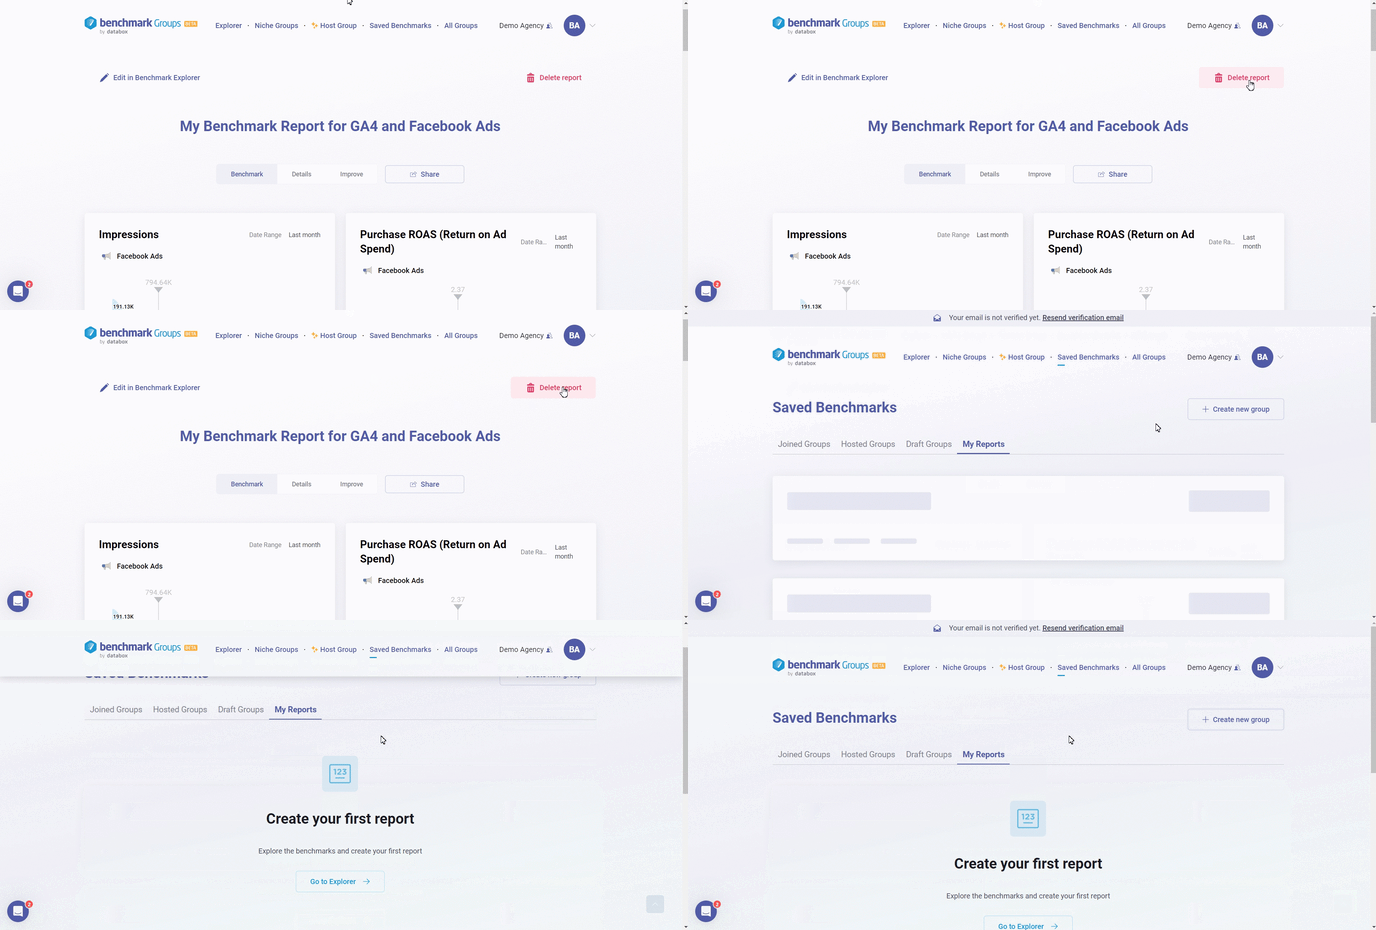
To delete your Benchmark Report, click on the Delete report button on the top right-hand side of your Benchmark Report. This will delete your Report, and it will take you to the My Reports section in Saved Benchmarks where you can view your other Benchmark Reports.