
Each SQL, Google Sheets, Excel, and Rest API Custom Metric supports only one data Aggregation function. To view the same SQL, Google Sheets, Excel, or Rest API Custom Metric with different Aggregation functions selected (i.e., "SUM" on one vs. "AVG" on another), follow the steps in this document to duplicate Custom Metrics and create the views you desire.
Navigate to Metrics> Custom Metrics
2 Find the Metric you'd like to set another Aggregation for, using the Search bar if necessary
3 Click on the arrow next to the Edit button to open the drop-down list. Select Duplicate.
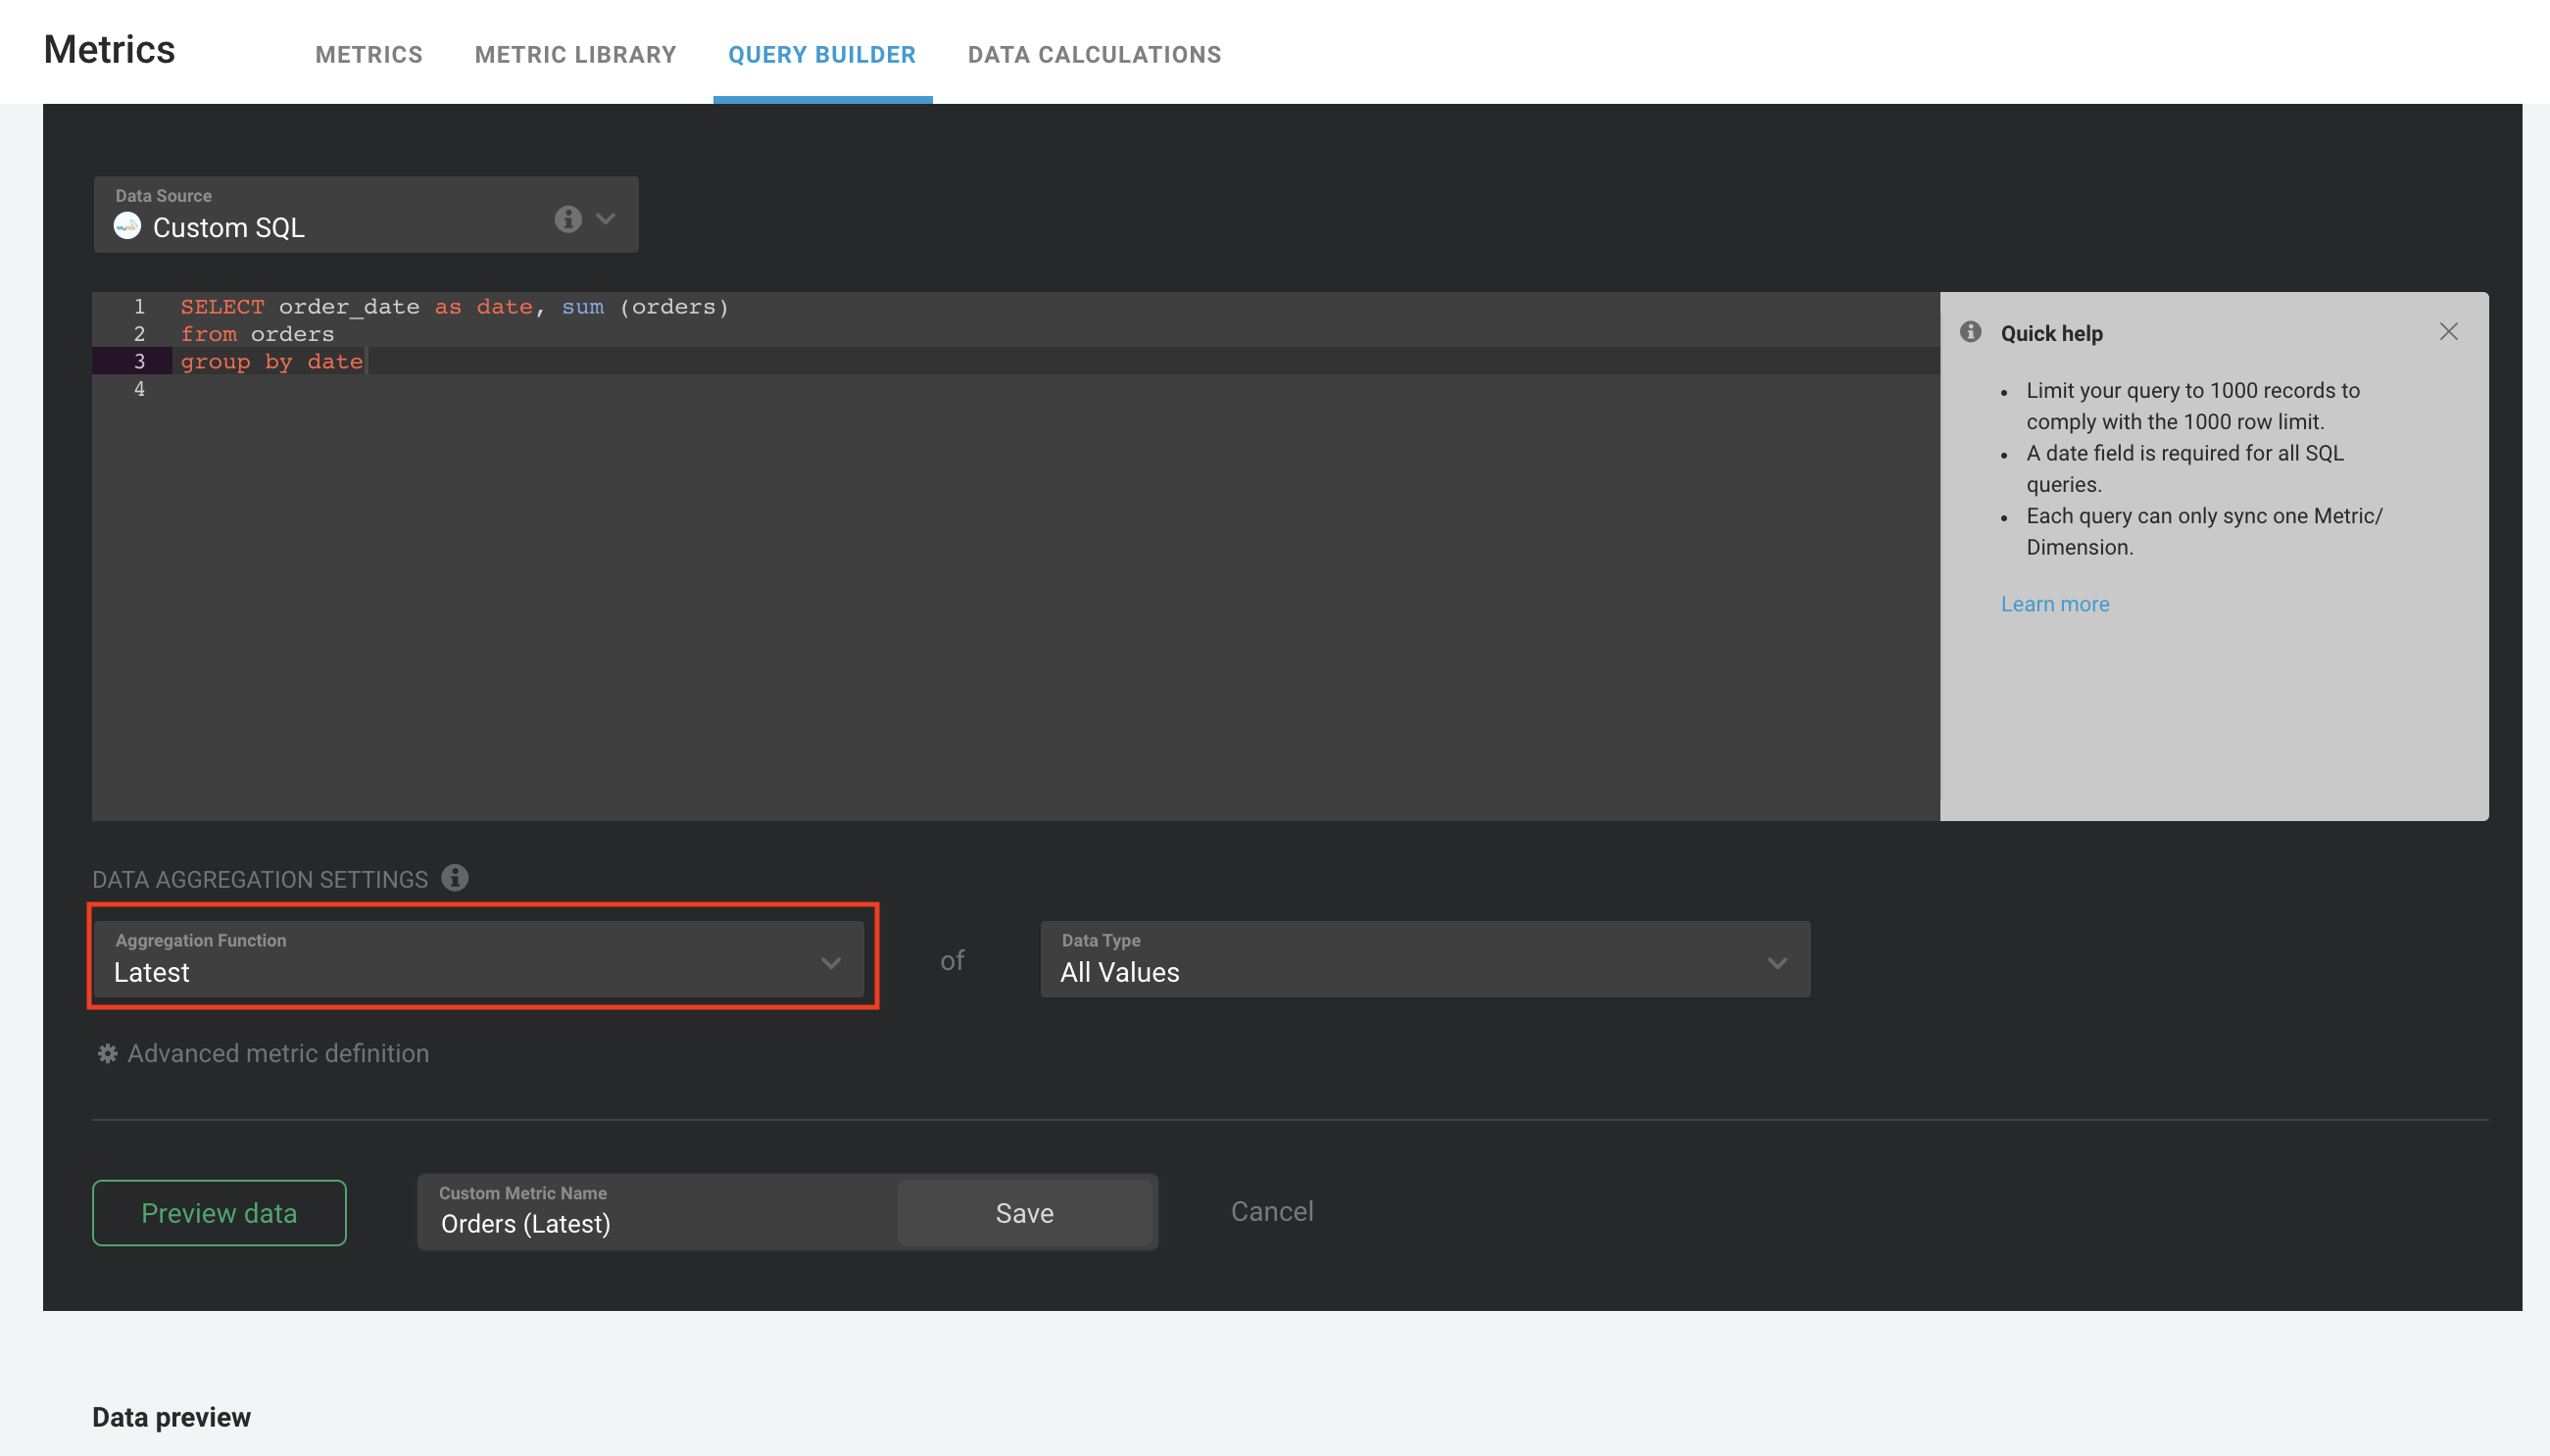
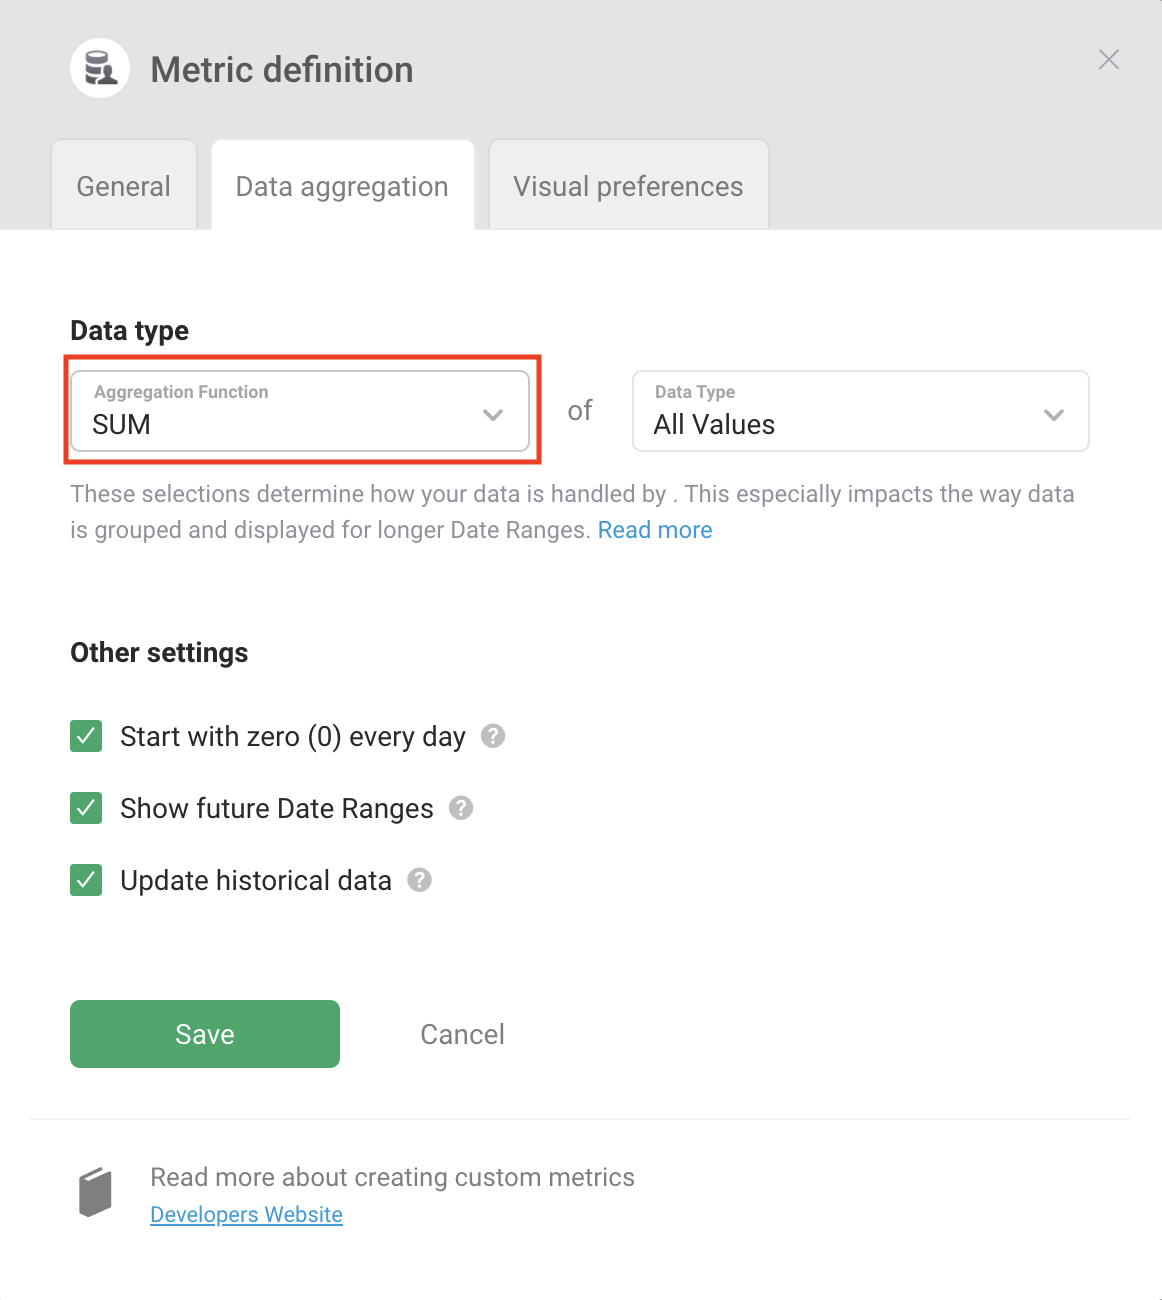
4 In the Data Aggregation Settings section, select the Aggregation Functionfor the Custom Metric. You can choose between Latest, SUM, MIN, MAX, AVG, and Count.
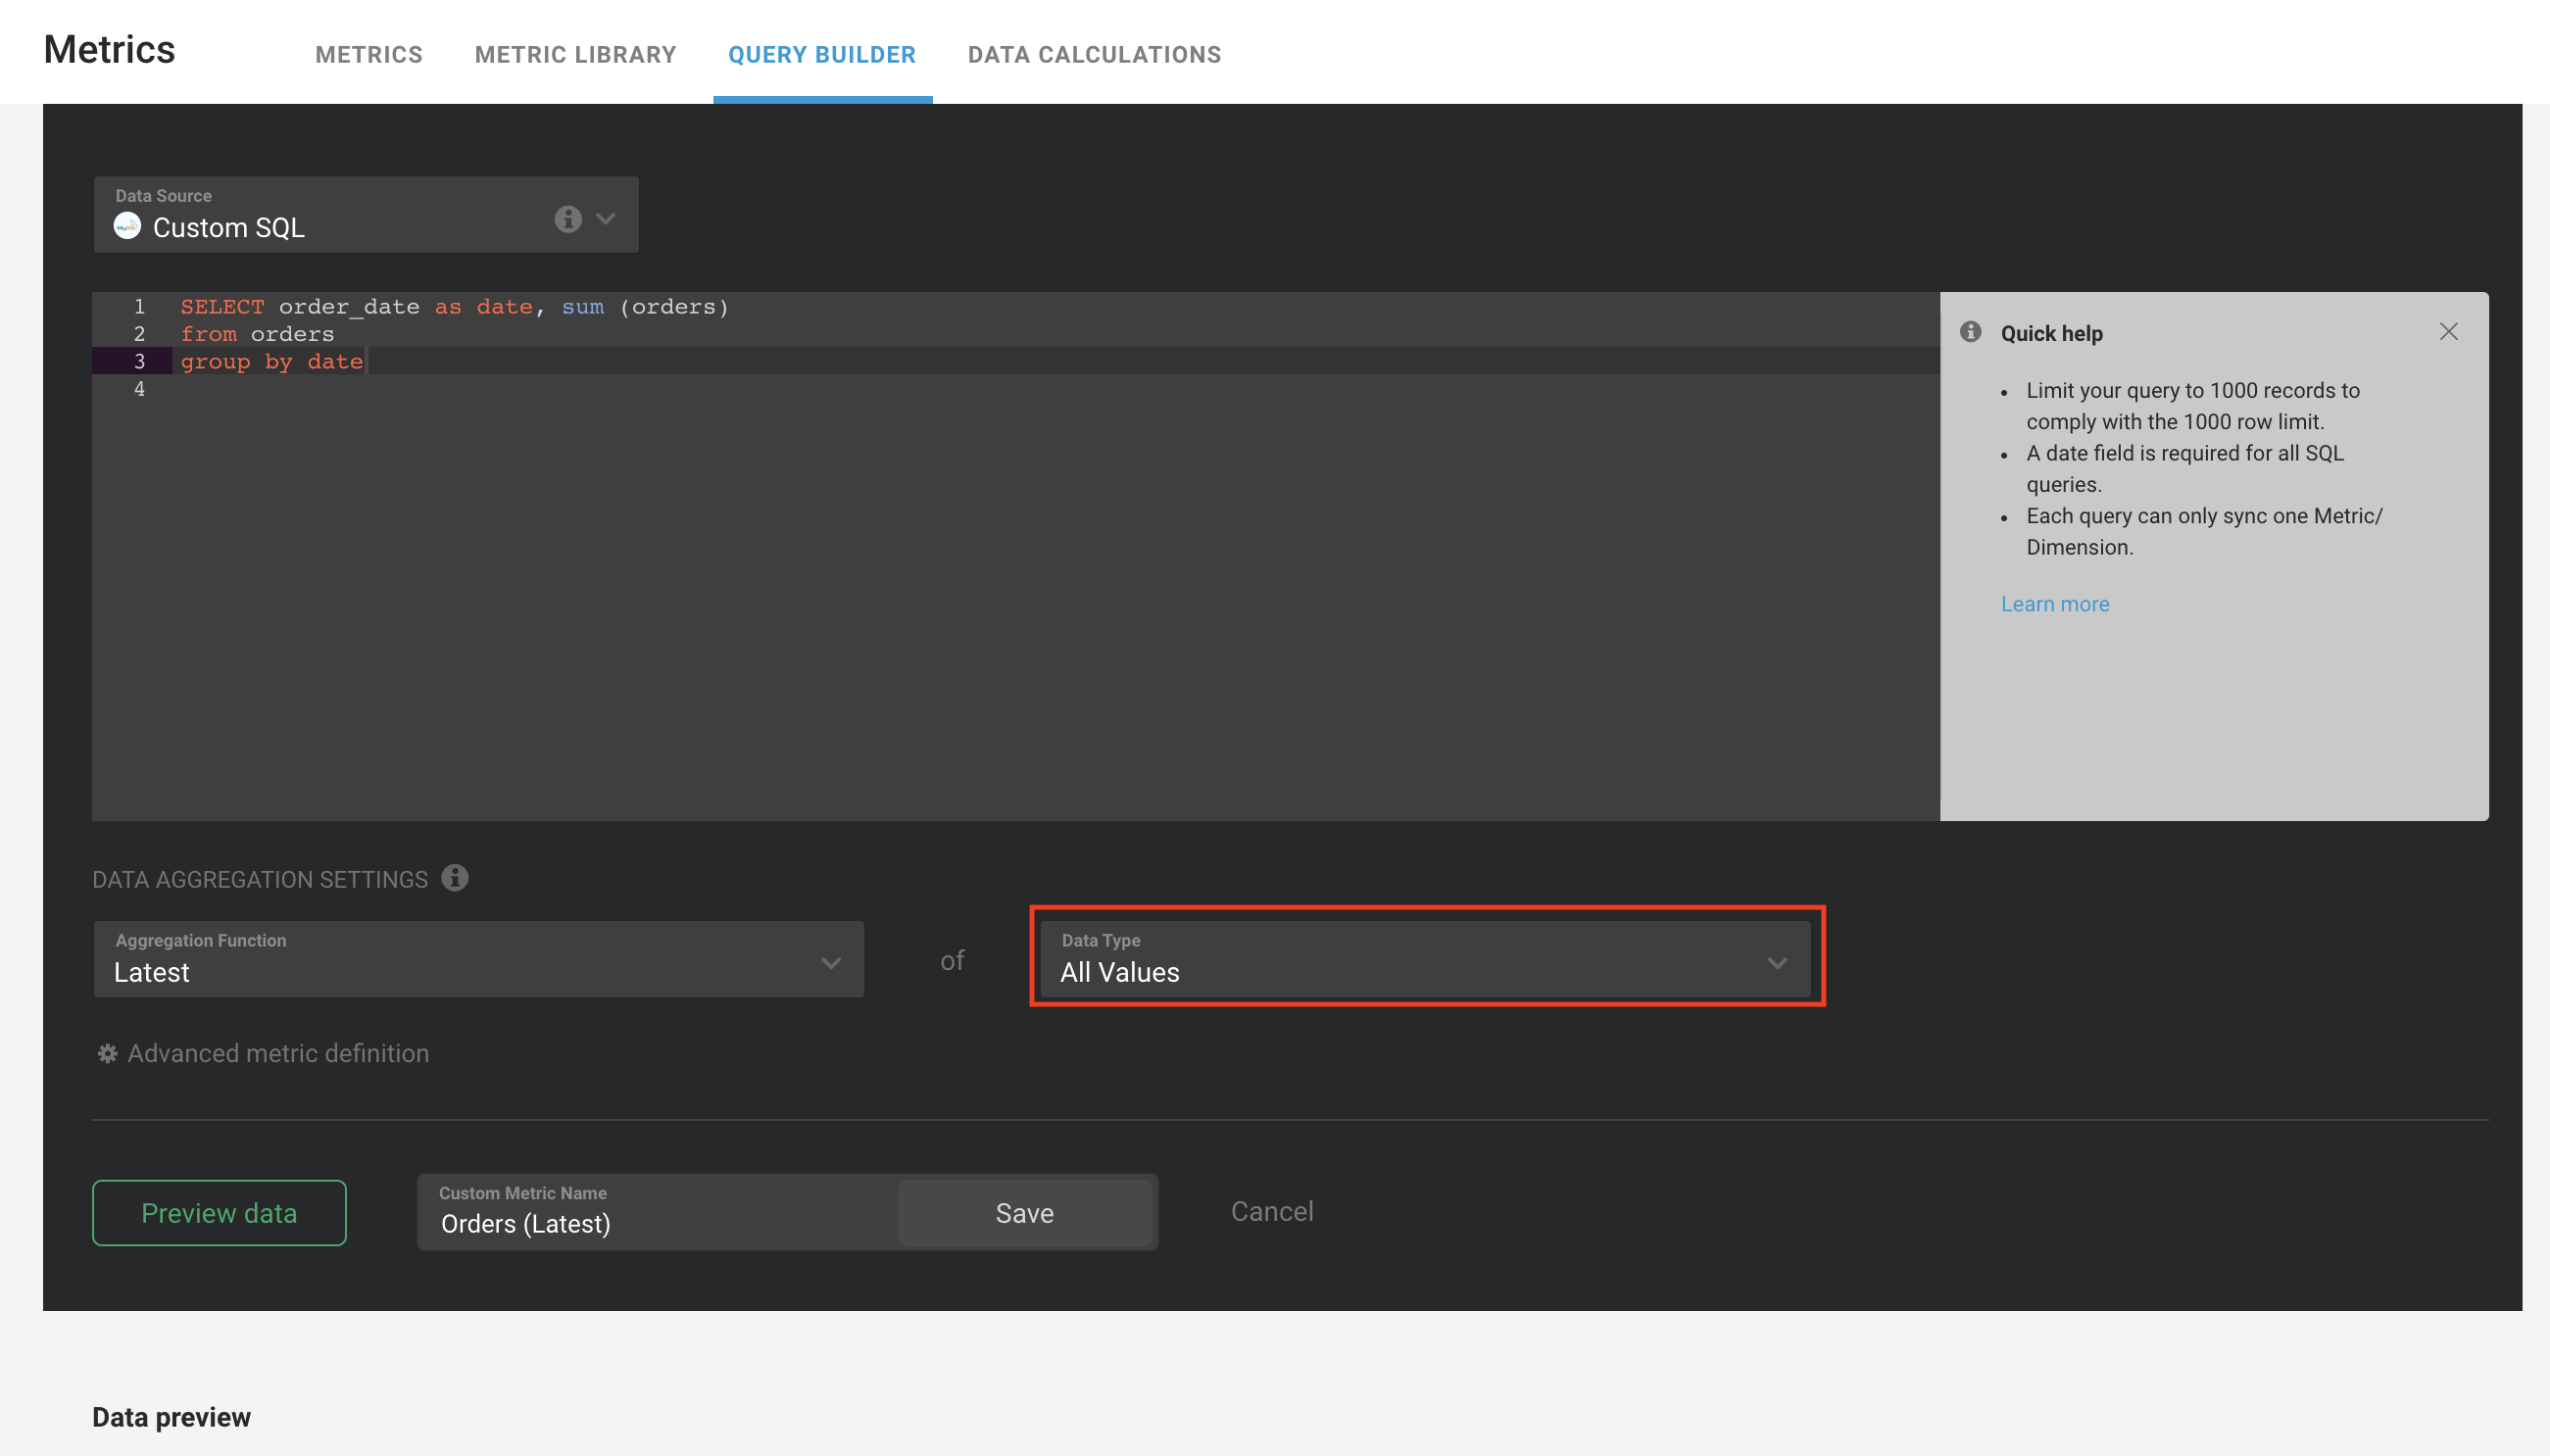
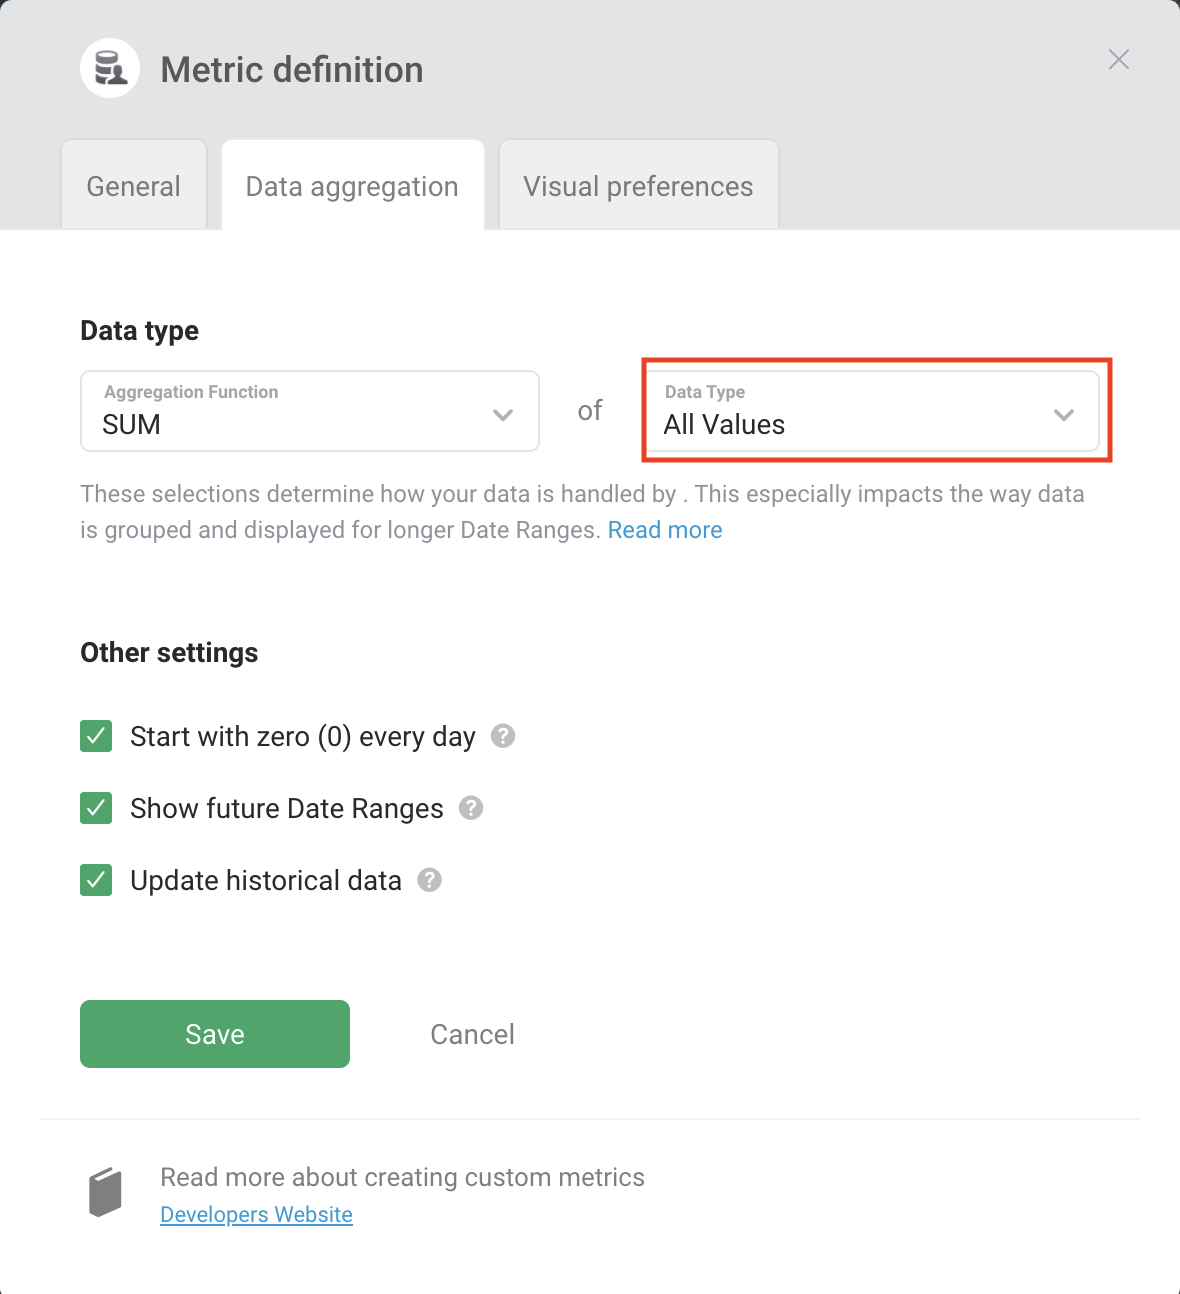
- Next, select the Data Type. You can choose between All Values and Period values. Learn more about Data Types here.
To accurately explain what this Custom Metric is reporting on, set a name for your Custom Metric
Click Preview data to generate a Data Preview of the Custom Metric
Once you confirm that these are the results you're looking for, click Save to save the Custom Metric.
How to set different data Aggregations for Google Sheets and Excel Custom Metrics
- Navigate to Metrics > Custom Metrics
- Find the Metric you'd like to set another Aggregation for, using the Search bar if necessary
- Click on the arrow next to the Editbutton to open the drop-down list. Select Duplicate.
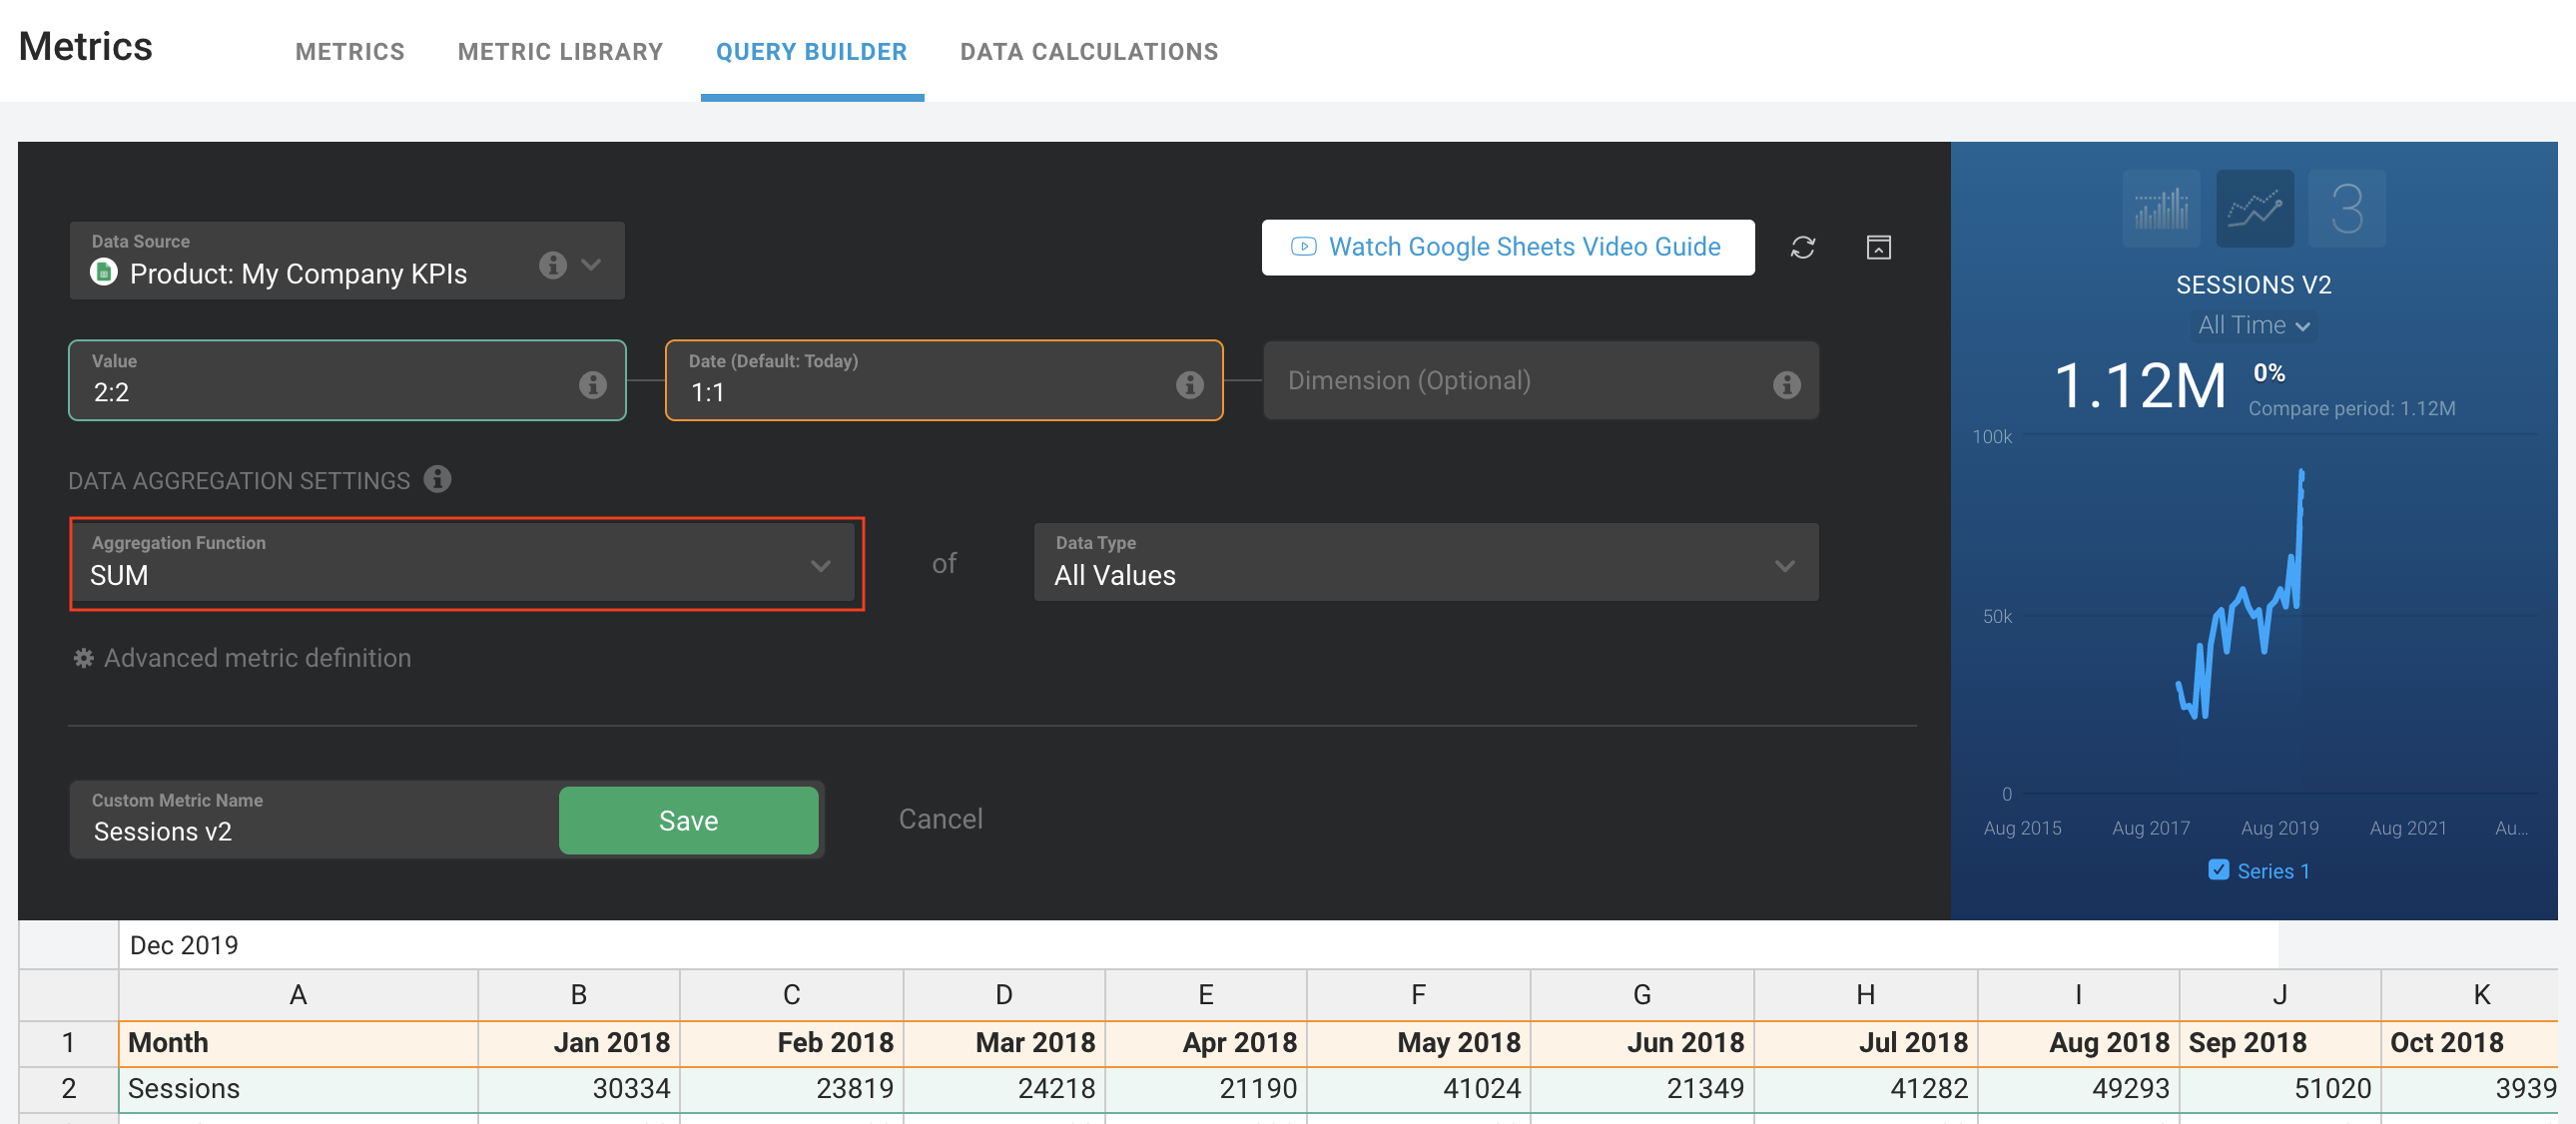
- In the Data Aggregation Settings section, select the Aggregation Functionfor the Custom Metric. You can choose between Latest, SUM, MIN, MAX, AVG, and Count.
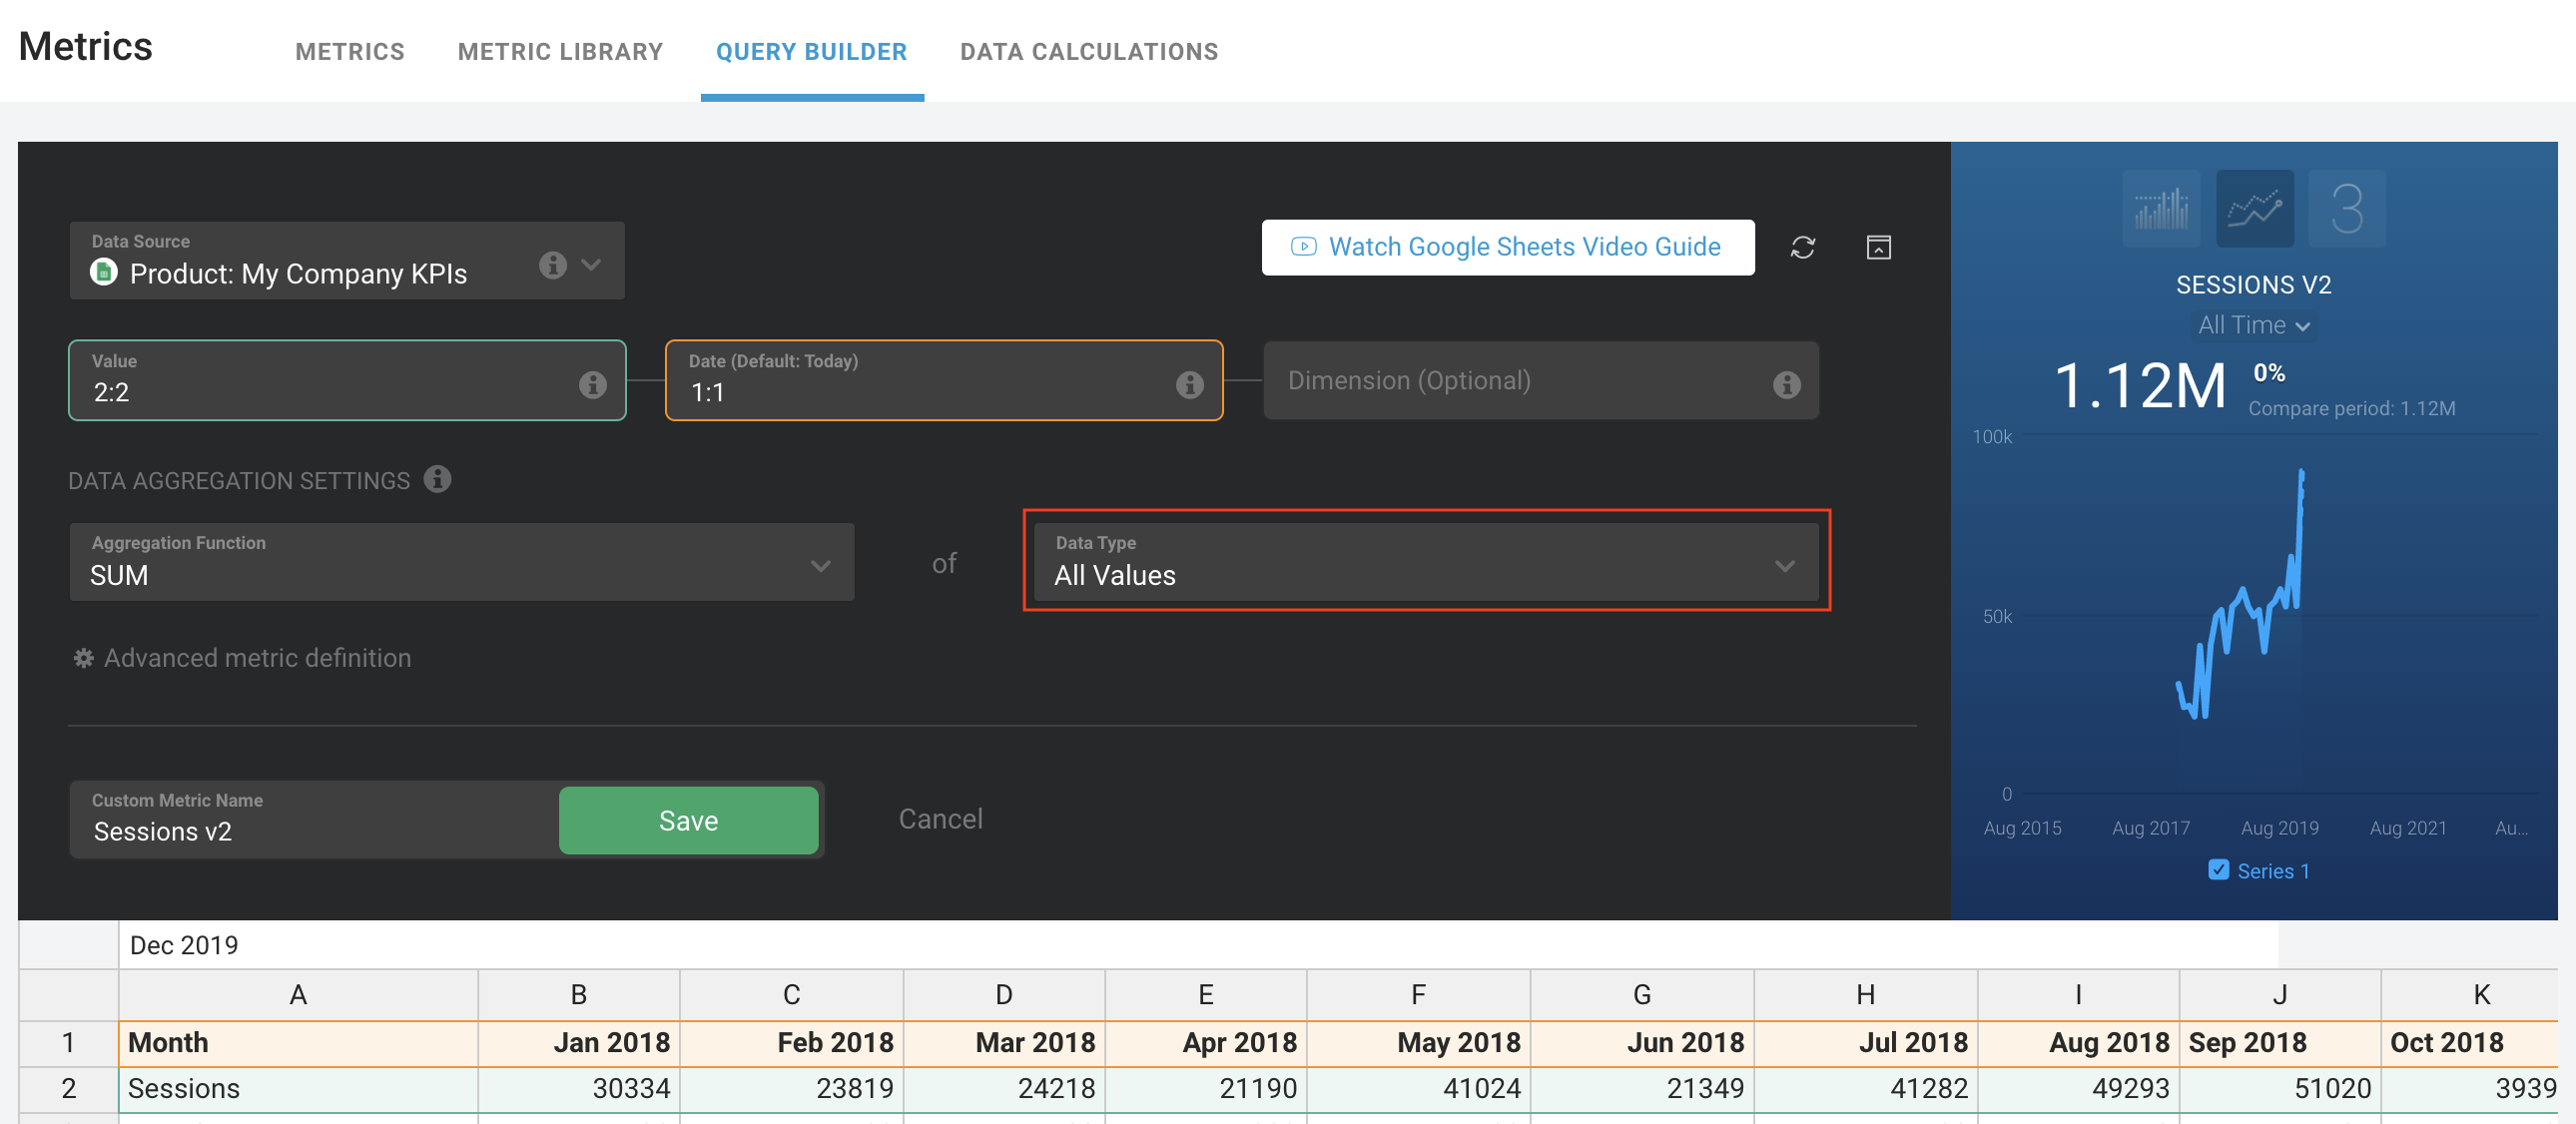
- Next, select the Data Type. You can choose between All Values and Period values. Learn more about Data Types here.
- To accurately explain what this Custom Metric is reporting on, set a name for your Custom Metric
- Click Preview data to generate a Data Preview of the Custom Metric
- Once you confirm that these are the results you're looking for, click Save to save the Custom Metric.
- Navigate to Metrics > Metric Library
- Find the Metric you'd like to set another Aggregation for, using the Search bar if necessary
- Click on the **...**hyperlink at the bottom of the Metric block
- Select Duplicate Metric . This will open the Metric definition window.
- In order to accurately explain what this Custom Metric is reporting on, set a name for your Custom Metric in the Display Name field
- Navigate to the Data Aggregation tab. In the Data Type section, select the Aggregation function. You can choose between Latest, SUM, MIN, MAX, AVG, and Count.
- Next, select the Data Type. You can choose between All Values and Period values. Learn more about Data Types here.
- Click Save to save the Custom Metric