How is data being calculated in the Databox Benchmarks
IN THIS ARTICLE
- What are Databox Benchmarks
- What is a Benchmark
- How are Benchmarks Calculated
- Your value in a Benchmark
-
How do we calculate benchmark value for different granulations
- Databox's Privacy Policy for Benchmarks
What are Databox Benchmarks
With Databox Benchmarks, you can benchmark your company's performance to compare how you're doing against businesses like yours. You can save Benchmarks in your Databox Analytics Account and use them to understand where you’re performing well, and where you have opportunities to improve.
Learn more about Databox Benchmarks here.
The Databox Benchmarks feature is available on the Growth and higher plans. Request a trial of Databox Benchmarks by following these steps.
What is a Benchmark
A Benchmark is a set of statistics calculated for a given metric in a benchmark cohort. A cohort, in this case, is a group of companies with shared characteristics.
How are Benchmarks Calculated
We calculate benchmarks from anonymized data of Databox users. Benchmarks are being calculated for the last month from data of all the participating contributors matching the Metric and the cohort, which is defined by selecting an industry, business type, employee size, annual revenue, or any of their combinations.
Mathematical calculations in Benchmarks
Let's explain the mathematical calculations in Benchmarks with a histogram.
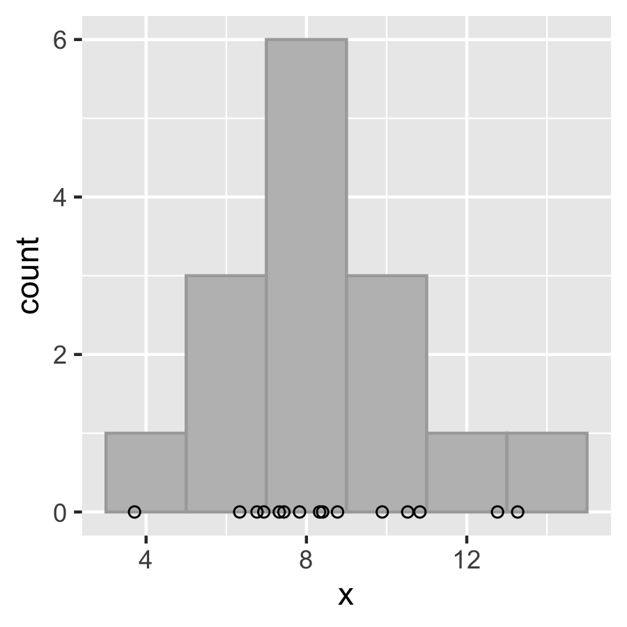
On this visualization, we can see that data is being distributed into equally-spaced bins and the number of values in each bin is being counted. Next, the bars are drawn for each bin, where the height of the bar is proportional to the number of values in each bin. See a histogram on the image below as an example.

The circles on the x-axis represent different values (for example, metric values in a benchmarks cohort). We divided the x-axis into 6 equally-spaced bins. We can observe that there is only one value in the first and last two bins, therefore the height of the bars of those bins end at 1 on the y-axis. In the fourth bin we have 3 values, and therefore the height of that bar is 3. The criteria for the value distribution into individual bins is that each bin represents value ranges (from-to) and we check into which bin our values fall and then count how many values are in each bin.
Such a visualization offers a quick insight into how the data is distributed. We can see that most of the values are close to 8, and the further we move away from it, the fewer values we observe.
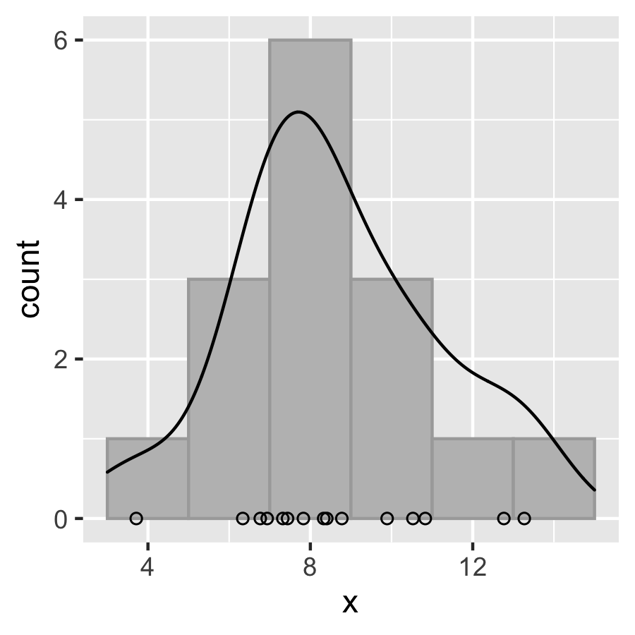
If we add smooth lines on the histogram, we can easily imagine the Hill Chart visualization.

The black line represents the Hill Chart for the same underlying values as the histogram’s. The height of the Hill Chart shows us where the most of the values are. The higher the hill, the more values we can find in that area (the values are the metric values from our contributors).
Your value in a Benchmark
Your value is shown on the graph with a vertical line. This makes it easy for you to compare your performance for the cohort that you have selected, and quickly identify the metrics where you are one of the leaders and metrics where you can improve your company's performance.

If your value is a statistical outlier, it will not fall within the bounds of the graph. In that case, your value will be shown on either the left border (if the value is significantly lower than other values) or the right border (if the value is significantly higher than other values).
For each benchmark, we also calculate the outrank ratio - how you compare to the companies included in calculating this particular benchmark. This value represents the percentage of companies your company outranks in this cohort, or what percentage of companies outperform you. For example, an outrank ratio of 0.69 shows that the company’s value is higher than 69% of other companies’ values in the group in case a higher metric value is positive (like Website Sessions) or, in case that metric is inverted, and lower value means better (like Churn), lower than 69% of other companies' values. An example of an outrank ratio is outlined below in the graph.

How do we calculate benchmark value for different granulations
Since benchmark values are calculated once per month for the last month, we perform mathematical calculations to create benchmark values for other chart granulations (Hourly, Daily, weekly, Quarterly, and Yearly).
|
Granulation |
General Aggregatable metrics |
General Non-Aggregatable metrics |
Current type metrics |
|
Hourly |
average value from the monthly median |
/ |
monthly benchmark median Example: |
|
Daily |
average value from the monthly median monthly median / number of days
|
/ |
monthly benchmark median Example: |
|
Weekly |
average value from the monthly median Example: |
/ |
monthly benchmark median Example: |
|
Monthly |
monthly benchmark median |
monthly benchmark median |
monthly benchmark median |
|
Quarterly |
the sum of monthly medians Example:
Quarterly median = 3,000+2,500+2,700 = 8,200 |
/ |
average of monthly medians Example:
Average quarterly median = (3,000+2,500+2,700)/3 = 2,733.33 |
|
Yearly |
the sum of monthly medians Monthly median for:
Quarterly median = 3,000+2,500+2,700+...+2,700 = 32,900 |
/ |
average of monthly medians Monthly median for:
Average quarterly median = (3,000+2,500+2,700+...+2,700)/12 = 32,900/12 = 2,741.67 |
How do we calculate granulations when:
- There is monthly benchmark data missing
We don’t calculate and don’t show any calculated benchmark value if there are more than 25% of monthly granulation points missing from the calculation range. - There is a monthly benchmark data point missing in the range (for calculating yearly granulation only)
We do interpolation of neighboring points for missing points. - There is a first/last monthly benchmark data point missing in the range (for calculating yearly granulation only)
For missing start and end points, we take value from the previous/next point. - Two consecutive monthly benchmark data points are missing in the range (for calculating yearly granulation only)
We don’t calculate and don’t show any calculated benchmark value if there is more than 25% of monthly granulation points missing. If there are less than 25% missing, we do interpolation of data for those points. - Weekly granulation and week falls within two different months (eg. the 30th is on Wednesday)
We calculate the average for every day of the week (the first average from Monday through Wednesday and a different average from Thursday till Sunday) and from those averages calculate the weekly average for that week.
Databox's Privacy Policy for Benchmarks
Databox may use your data to calculate and provide benchmarking services. The data collected for participation in the benchmarks ecosystem shall, at any time, be anonymized and removed from any personal or sensitive information.
In addition, to ensure anonymity, benchmarks shall be calculated and available only, if Databox has at least 15 different sources of data within the selected cohort.
You may, at any time, decline to participate in benchmarks by logging in to your account and opting-out. Learn how to opt out of benchmarks here. Please note that if you want to use the benchmarks feature, you have to give your permission to contribute to the benchmarks.
Learn more about our Privacy Policy here.