How do I add Benchmarks to my Databoards
You can add Benchmark data directly on your dashboard, to see how you’re performing compared to other companies. By including a Benchmark line on your Bar or Line chart, you’ll be able to:
- Compare your performance against standard benchmarks, custom cohorts, or similar businesses.
- Easily spot areas for improvement and make more informed decisions.
- Track your goals alongside your benchmark lines, and see if your efforts are moving you in the right direction.
- Quickly see if you’re exceeding, meeting, or falling short of expectations.
This feature is available on Growth and Premium plans. Request a trial of this feature by following these steps.
IN THIS ARTICLE
- How to add Benchmark lines to Charts
- How do we calculate the benchmark value for different granulations
- Additional Information
How to add Benchmark lines to Charts

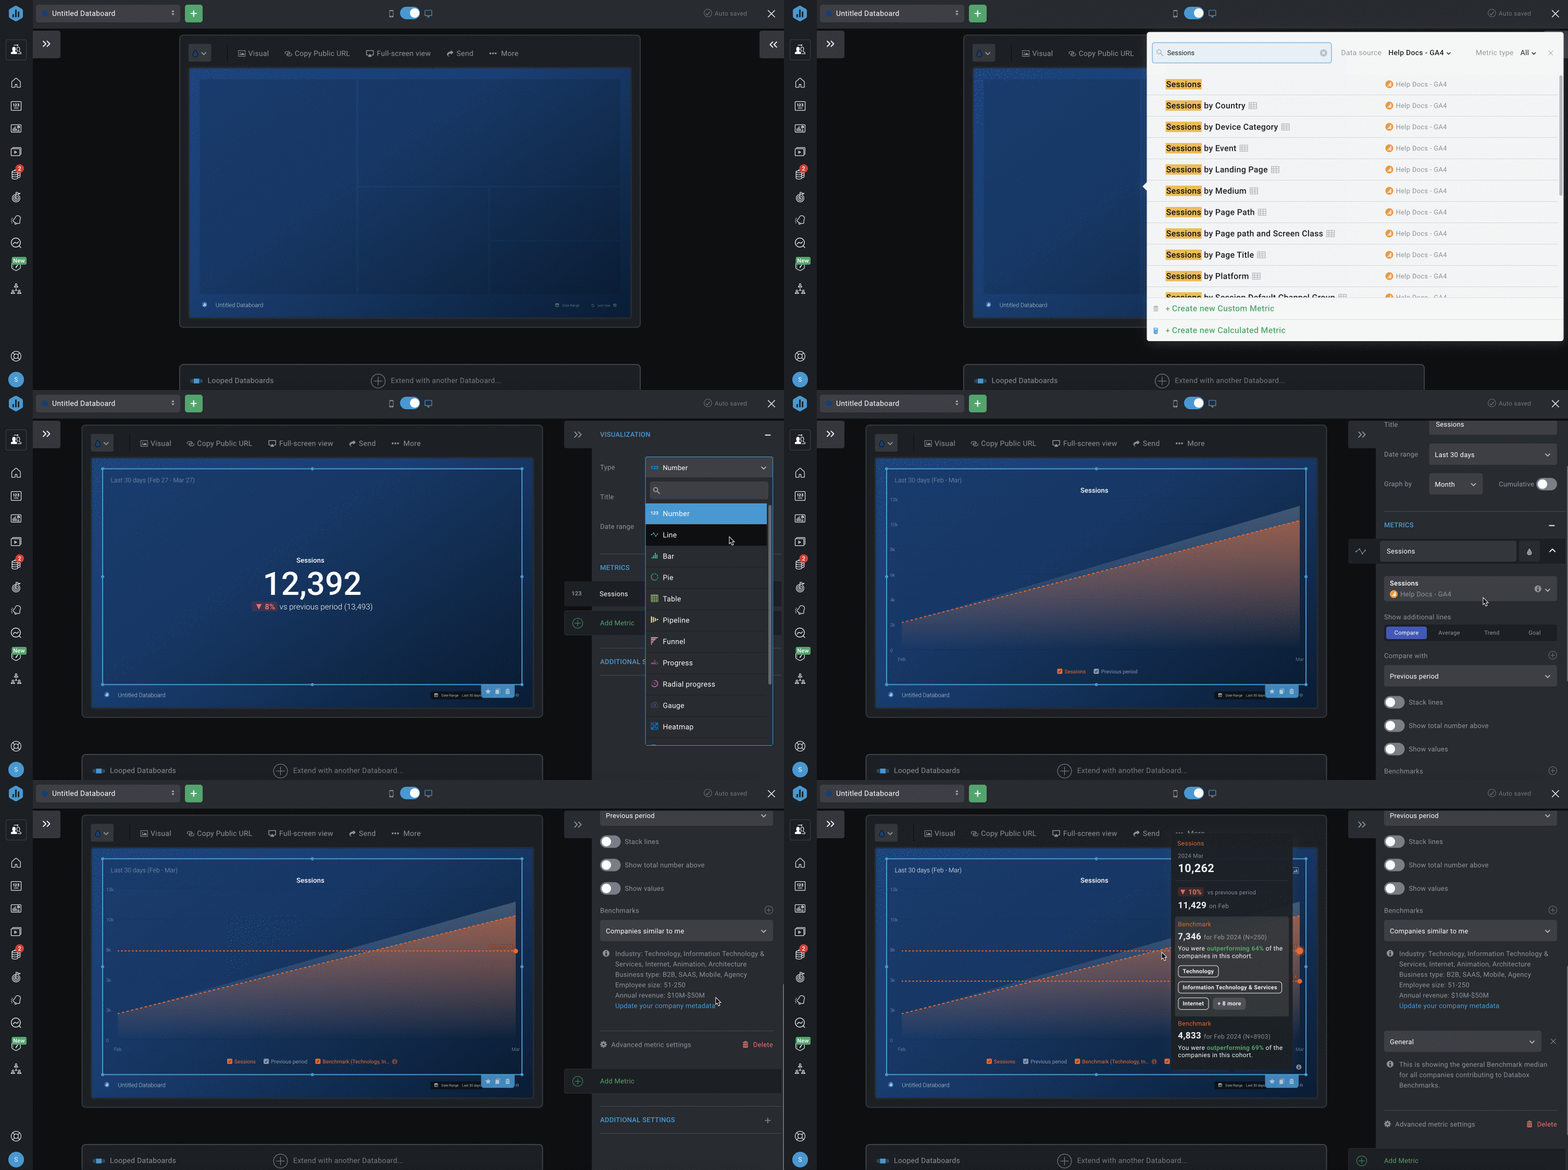
- Navigate to Databoards. Open an existing Databoard or create a new one by selecting + New Databoard > Start Blank
- Click on an empty Datablock to add a Metric.
- Choose the Data Source you want to add to the Databoard from the Data Source drop-down list.
- Search for a pre-built Datablock that reports on the data you're looking for, using the Search bar if necessary. Navigate between Favorite Basic, Custom, and Calculated Metrics by clicking on the Show drop-down.
- Click on the green + button to add the Datablock to your Databoard. Another way to add the Datablock is to drag and drop the selected Datablock onto your Databoard. The Datablock from the Metric Library will automatically populate with data from the selected Data Source.
- Click on the Datablock on the Databoard to open the corresponding Datablock Editor on the right-hand side of the Designer.
- If your Metric is not displayed as a Line or Bar Chart, navigate to the Visualizations and select Line or Bar Chart as the Visualization type from the drop-down list.
- Navigate to the Metrics section and click on the Benchmarks dropdown list to select one of the following Benchmark options:
-
General: This will display the general Benchmark median for all companies contributing to Databox Benchmarks.
-
Companies similar to me: This will display the Benchmark of companies that are similar to you. This cohort is created from the company information you have added to your Databox account, such as your Industry, Business type, Number of Employees, and Annual revenue. You can update your Company Information by clicking on Update your company metadata.
-
Selected cohort: This will display the Benchmark of the cohort that you can manually select. Select the cohort by clicking on Update Cohort.
-
-
To add another Benchmark line, click on the + button next to Benchmarks.
- Hover over the Line or Bar Chart to view the Chart Tooltip.
How do we calculate the benchmark value for different granulations
Learn how we calculate the benchmark value for different granulations here.
Additional Information
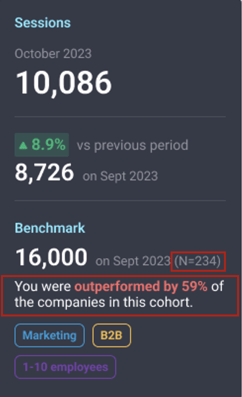
- On the chart tooltip, you can see the data on the benchmark value and cohort, and when monthly granulation is selected, you will see if you are outperforming and the number of contributors (monthly and daily benchmarks only). The number of contributors are displayed by N, for example N=230.
