
ChartMogul is a subscription analytics platform that consolidates revenue data from your payment processors to give you a clear picture of MRR, ARR, churn, customer lifetime value, and cohort performance. It normalizes billing data across sources like Stripe, Braintree, and Recurly, and surfaces the subscription metrics that matter most to revenue teams. Connecting ChartMogul to Databox brings those metrics into a shared workspace alongside your other data sources, so you can build unified revenue Databoards, set goals, track trends over time, and share results with stakeholders — all in one place.
If your credentials don't include full access to the data source, make sure your access level meets any permission requirements listed in the Specification section of the integration's page in the Metric Library.
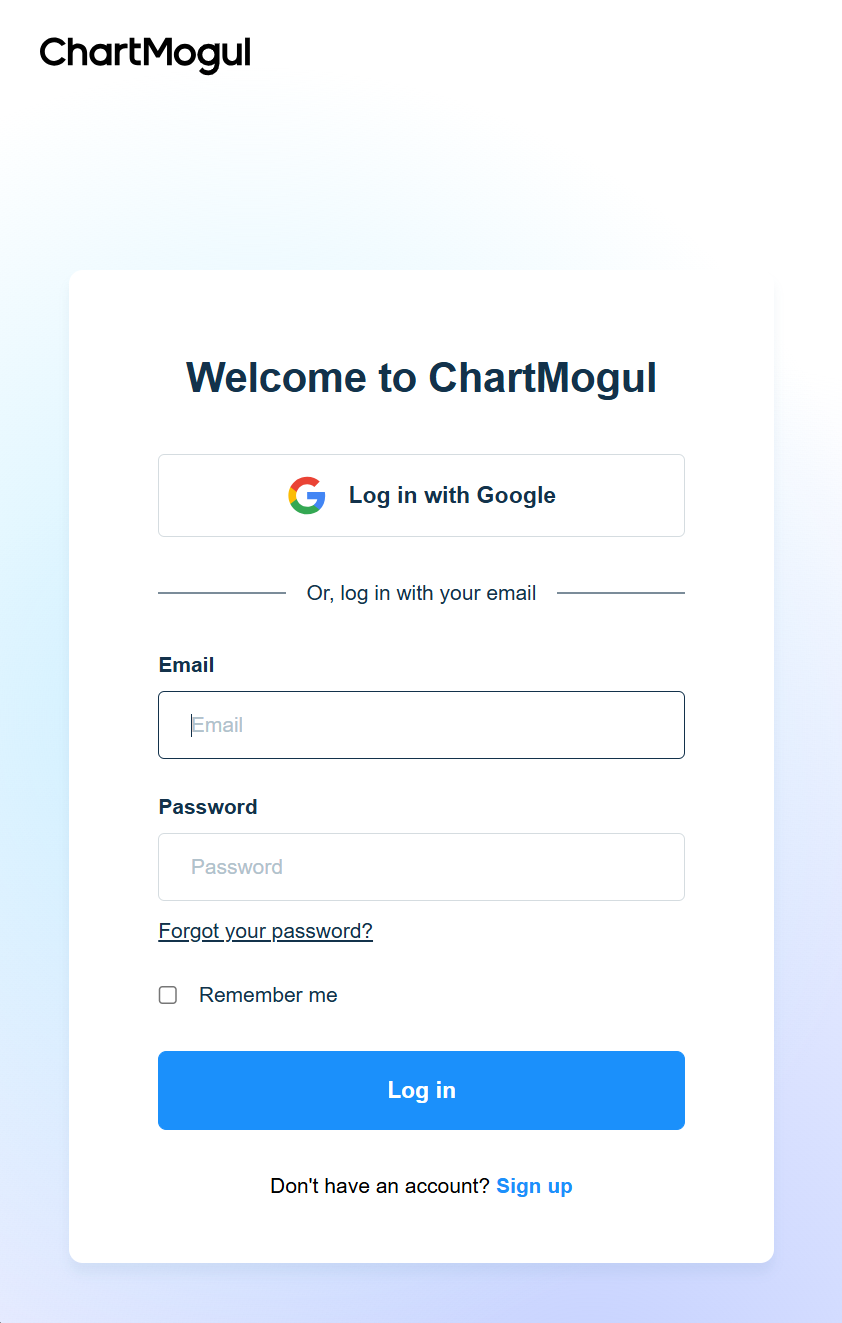
To connect ChartMogul to your Databox account for the first time or with new credentials, sign in with your ChartMogul email and password, or continue with Log in with Google.
For comprehensive details on metrics, data availability, templates, specifications, usage guidelines, and other key information, refer to the resources listed below.


