Guide: Using Amplitude with Databox
Explore how to connect and visualize your Amplitude data in Databox Analytics.
HOW TO
- Connect Amplitude to Databox
- Build a Databoard using Amplitude data
- Use the Metric Builder for Amplitude
- Additional Information
How to connect Amplitude to Databox
IN THIS SECTION
- How to connect Amplitude to Databox
- What’s the maximum amount of historical data initially available when you use a new Amplitude Metric in Databox?
- What time zone does Amplitude data sync in?
- How often does Amplitude data sync?
How to connect Amplitude to Databox

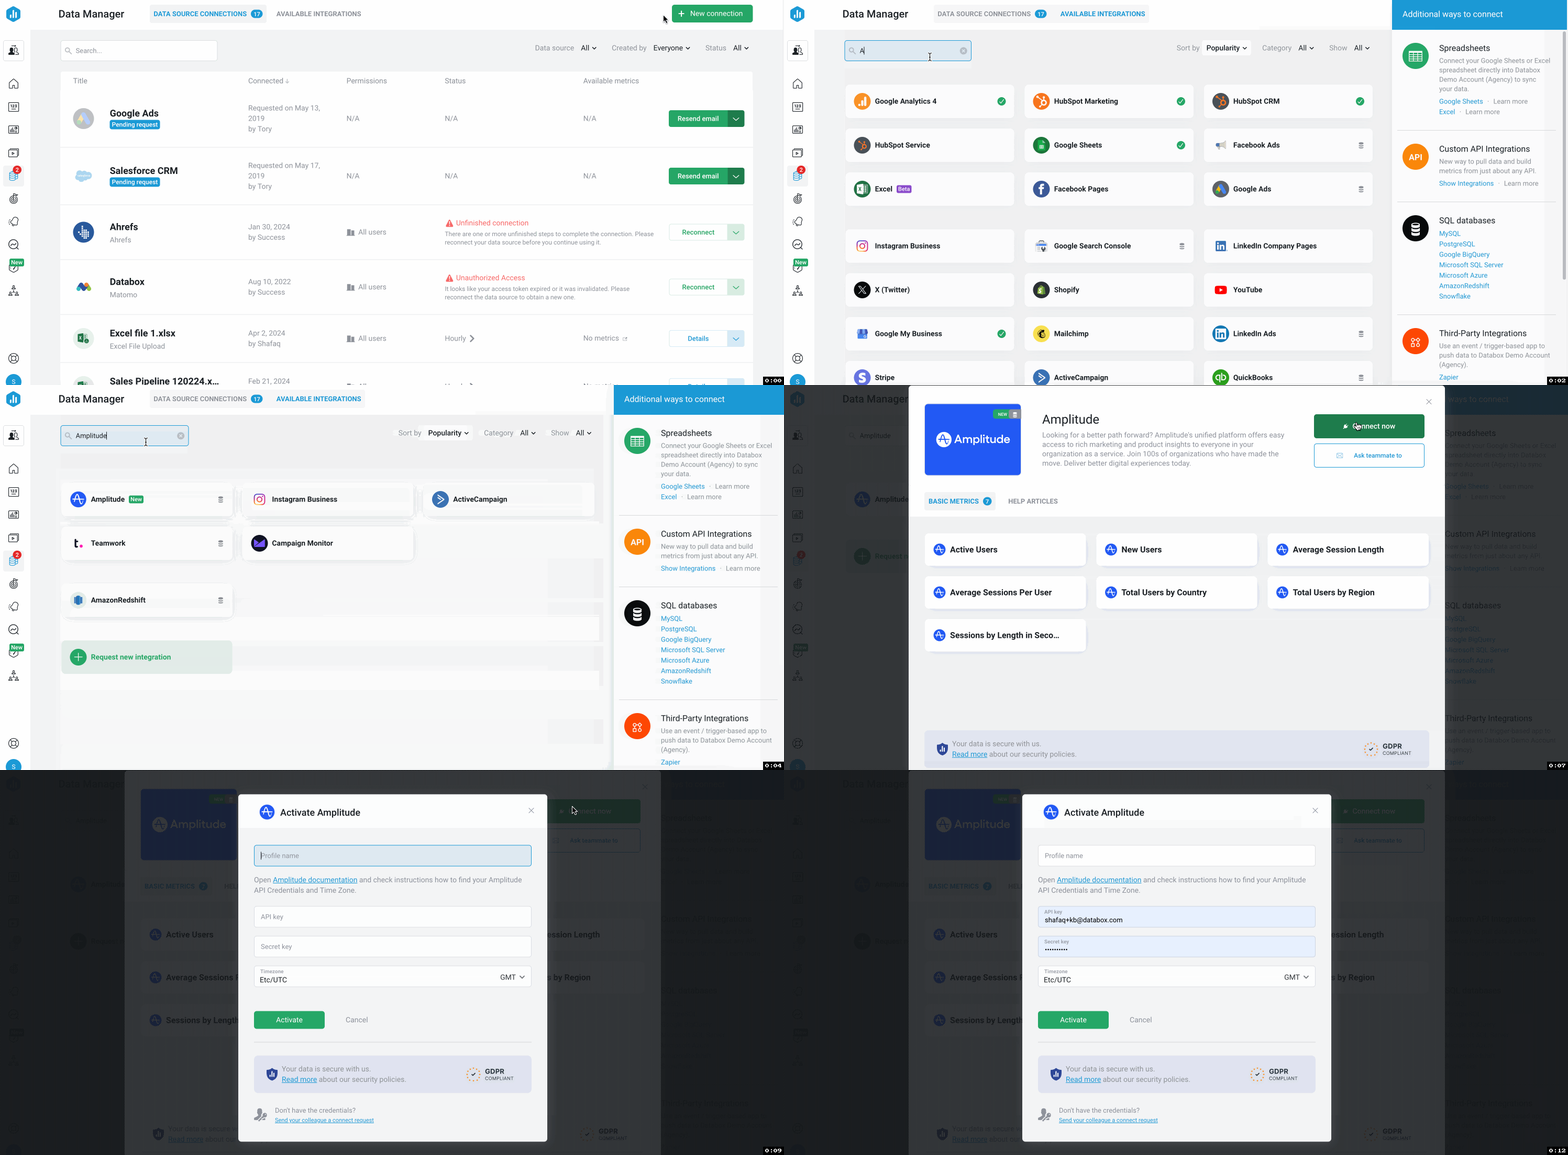
To connect an Amplitude Account in Databox, go to Data Manager > + New connection. Type Amplitude in the search bar and click on the green Connect button. Next, click the green Connect now button.
This will open the Authorization window, which is where you will be prompted to enter your API Key, Secret Key and your Timezone set in your Amplitude Account.
Open the Amplitude documentation and check instructions how to find your Amplitude API Credentials and Time Zone.
Pro Tip: Each Amplitude Account must be connected as a separate Data Source in Databox (1 Account = 1 Data Source). Learn more here.
What's the maximum amount of historical data initially available when you use a new Amplitude Data Source Metric in Databox?
Pro Tip: In order to start syncing data for a Metric, you can add it to your Metrics screen, use it in a Scorecard, set a Goal around it, create an Alert for it, or add it to a Databoard. Learn more here.
The amount of historical data you're able to access in Databox is dependent on your Databox plan. Learn more here.
What time zone does Amplitude data sync in?
Amplitude data is synced in the time zone set in the Amplitude Account. For example, if your Amplitude Account time zone is set as EST, your Amplitude data will sync with Databox in EST.
How often does Amplitude data sync?
All Amplitude Data Sources will sync every hour with Databox. Learn more here.
How to build a Databoard using Amplitude data
IN THIS SECTION
Popular Amplitude Metrics
View a full list of Amplitude Metrics available in Databox here.
How to build a Databoard
- Navigate to Databoards > + New Databoard > Start Blank
- Go to the Datablock Library on the left-hand side of the Designer to find the Metric Library.
-
Select the appropriate Amplitude Account from the Data Source drop-down list in the Metric Library.
-
View the list of pre-built Amplitude Datablocks in the Metric Library. Drag and drop your selected Datablock onto your Databoard.
- If a pre-built Datablock isn't available for your use case, navigate to the Visualization Types section above the Metric Library.
- View the list of Visualizations available in Databox. Click on the Visualization or drag and drop the selected Datablock to your Databoard.
-
Click on the Datablock on the Databoard to open the corresponding Datablock Editor on the right-hand side of the Designer.
-
In the Metrics drop-down, click Data Source to select the appropriate Data Source. This will filter out metrics from the specific Data Source.
-
In the main Metrics drop-down, select the metric you'd like to display on the Datablock, using the Search bar if needed. This will update the Datablock, and it will populate with the corresponding data.
-
Complete steps 4-9 until your Databoard is complete.
How to use the Metric Builder for Amplitude
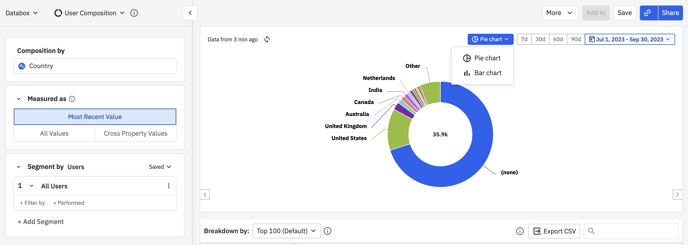
With the Metric Builder for Amplitude, you can create Custom Amplitude Metrics using a combination of Metrics, Dimensions, and Filters. You can use the Metric Builder for Amplitude TO track Segmentation, Active/New Users, User Composition, Sessions by Length and Funnel.
Learn more about the Metric Builder for Amplitude here.
Additional Information
IN THIS SECTION
Metric Considerations
The following considerations are due to API limitations and the availability of data:
- Last X days on the Amplitude UI corresponds to last X+1 days, including today on Databox UI. For example, If the last 2 days are selected on Amplitude, the last 3 days including today must be selected on Databox.
- The "Total Users" Metric corresponds to the “Most Recent” values in your Amplitude Account. This is selected as default in your Amplitude Account.

- The Cumulative toggle can be enabled for the Custom Metrics, but this can lead to data discrepancies as none of the Metrics support this functionality due to technical limitation.
- For the Amplitude Metric Builder (Sessions by Length), we highly encourage users to input a desired value for the Bucket size. When the Bucket Size isn't specified, Amplitude tries to find the best bucket sizing. For example, if you set Min Value to 0, Max Value to 10, and select minutes as the unit, there is no guarantee for the final number of buckets or bucket bounds.
Granularity Restrictions
- For the Basic Metrics "Active Users", "New Users", "Average Session Length" and "Average Sessions Per User" and the Custom Metrics that are created by using the Amplitude Metric Builder (Segmentation, Active / New Users and Funnel), only Daily, Weekly and Monthly granularity is supported.
- Weekly granulation is supported, but it can cause data discrepancies if you have the first day of the week setting in your Databox Account to a different day in comparison to the first day of the week set in your Amplitude Account.
- Due to API limitations, Quarterly, Yearly and All Time granularity is not supported for these Metrics. This may affect visualization options for Charts in Databox. Learn more about Granularity here.
- For the Basic Metrics "Total Users by Country", "Total Users by Region", "Sessions by Length in Seconds" and the Custom Metrics that are created by using the Amplitude Metric Builder (User Composition and Sessions by Length), Daily, Weekly, Monthly. Quarterly, Yearly and All time granularity is supported.
- For Daily granularity, the maximum data we’re able to fetch is 60 days in the past.
- For Weekly granularity, the maximum data we're able to fetch is 6 months in the past.