
In Databox, you can identify metric values that fall outside the expected range of variation. Since most business metrics fluctuate around an average value, Databox leverages historical data to define this expected range. Values that fall outside this range are flagged as anomalies by the anomaly detection model.
For more information on the methodology and details of the anomaly detection model, click here.
This functionality is available for individual metrics within the Metric Insights section of your Databox account. To use it, follow these steps:
- Navigate to Metrics > Metric Insights.
- Select the metric you want to analyze and, if it's dimensional, choose the relevant dimension.
- In the top right corner of the chart, select either Line or Bar visualization.
- In the top left corner of the chart, toggle Highlight Anomalies to enable anomaly detection.
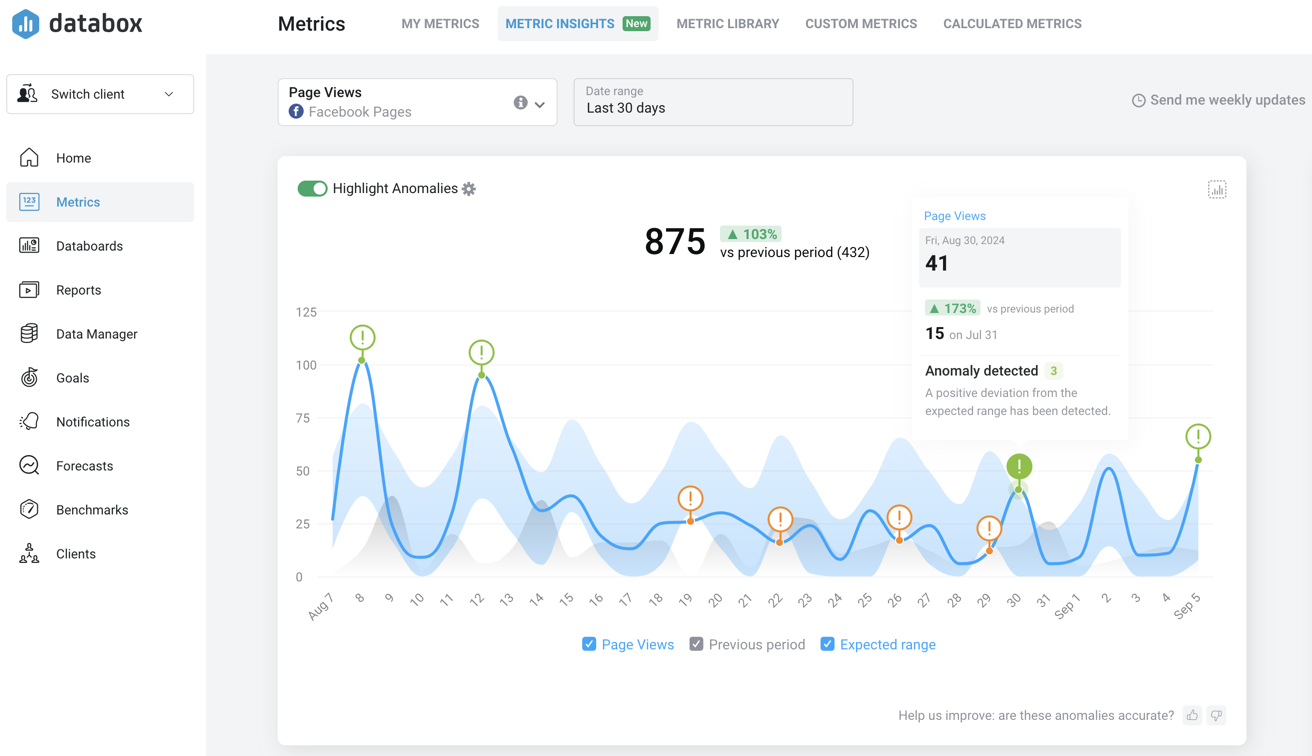
The time series chart will display the following components:
- Blue line/bars: Actual metric values
- Gray line/bars: Metric values from the previous period
- Light blue area: Expected range of variation based on model predictions
- Exclamation marks: Detected anomalies, with green indicating positive deviations and orange/red indicating negative deviations
If the expected range of variation is too wide or too narrow for your data, update it by clicking the cog icon  and adjusting the following settings:
- Sensitivity: Controls the number of data points classified as anomalies. By default, the model is set to identify around 1% of data as anomalies. Increasing sensitivity will detect more anomalies, while decreasing it will capture fewer.
- Extend training period: Increases the number of data points used for training, enhancing the model's ability to distinguish between normal variations and true anomalies.
- Adaptability: Adjusts how much the model adapts to new or evolving trends.
The table below outlines the historical data requirements for detecting and highlighting anomalies at each granularity level:
| Granularity | Minimum required |
|---|---|
| Daily | 30 days |
| Weekly | 12 weeks |
| Monthly | 6 months |
FAQ
How can detecting data anomalies be valuable for my business?
Detecting data anomalies can provide valuable insights and help your business in several ways:
- Identify critical events: Pinpoint specific events or periods with unusual spikes or drops in metrics, allowing you to focus on key moments of change.
- Understand causes: Investigate the root causes of anomalies to determine whether they were due to operational issues, market changes, or other factors, helping you address problems or capitalize on opportunities.
- Optimize performance: Gain insights into normal data patterns and variability, improving your ability to set realistic benchmarks and make data-driven decisions.
- Enhance forecasting: Refine your forecasting models by understanding deviations from expected trends, leading to more accurate predictions and better strategic planning.
What does the number next to 'Anomaly detected' represent?
The number indicates the degree of deviation from the expected variation range, reflecting how far a data point is from this range. It is calculated based on the distance between the observed value and the nearest boundary of the expected interval. A higher number signifies a greater deviation and a more significant anomaly. These scores are normalized on a scale from 0 to 100.
Why is my expected range of variation so wide?
The width of the expected variation range is influenced by several factors:
- Adaptability: This determines the number of changepoints in the trend. A less adaptable model may fail to adjust to new patterns, leading to a wider range.
- Data variability: This refers to the extent of deviation of data points from the trend line. Higher variability in the data increases the width of the expected range.
A more adaptable model generally results in a narrower expected variation range because it better estimates variability around the trend and adjusts to lower levels of data variability.
Why might a data point be flagged as an anomaly at one time but not later?
Anomaly detection can change as new data points are introduced. For example, if the model initially flagged a data point as anomalous, this could be because the data at that time was significantly different from historical patterns. However, as new data points are recorded and the model updates its estimation of expected variability, what was once considered an anomaly may now fall within the updated range. If recent data shows a new trend or pattern, the model adapts, recalibrating its expectations and potentially reclassifying previously anomalous points as normal.


