Goals in Databox help you track progress toward key metrics, whether you want to hit specific targets or maintain performance levels. You can create goals that update automatically from your data sources or update progress manually. With advanced settings, clear success criteria, and team ownership, Goals make it easy to measure what matters most and keep everyone aligned.
You can create a goal in the following ways:
- From scratch: On the Goals page, click on + Create goal.
- From a metric: Locate the metric on the My Metrics, Metric Insights, Metric Library, Custom Metrics, or Calculated Metrics page, then open the drop-down menu (three dots, down arrow (
 ), or "More") and select Set a goal.
 - From a Databoard: Click on a Datablock to open the Datablock Editor. Expand the metric's settings, go to the Compare with section, and select Other > Goal. Then, click the Set goal link to define your goal.
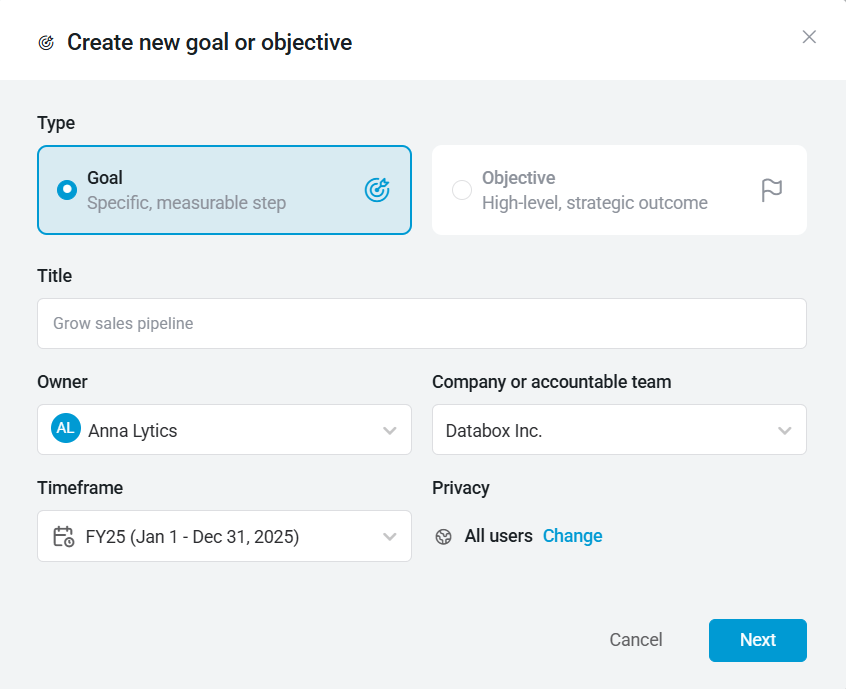
Enter the key information that defines the goal:
- Select Goal as the type.
- Enter a title that clearly describes what you want to achieve.
- Choose an owner (yourself or another user) and specify who the goal belongs to — either the company or an accountable team.
- Select a timeframe to define when the goal applies.
- Set privacy to determine who can view the goal — choose Public, Selected users, or Private.
The next step is to define how progress will be measured. You can track progress automatically using connected data, manually through updates, or by rolling up results from other goals.
| Metric (Automatic) | Manual |  Sub-goals (Automatic) Sub-goals (Automatic) | |
|---|---|---|---|
| Progress updates automatically based on a metric from a connected data source. | You enter progress updates yourself. | Progress is calculated automatically from linked sub-goals. | |
| You'll select the metric and breakdown, set a target (fixed value, percent change, or other metric), and define a success condition — reach, stay above or stay below. | Define start and target values, choose a unit type (number, percent, or currency), and record progress as you reach milestones. | Choose a measurement type (percent average, number sum, or currency sum). Parent progress updates when sub-goals do. | |
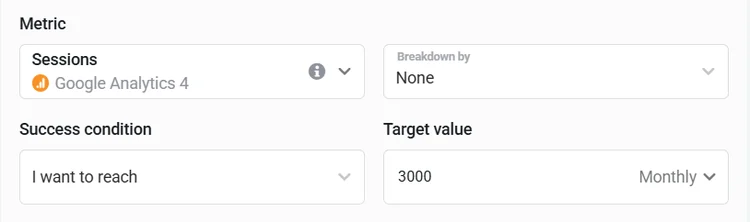 | 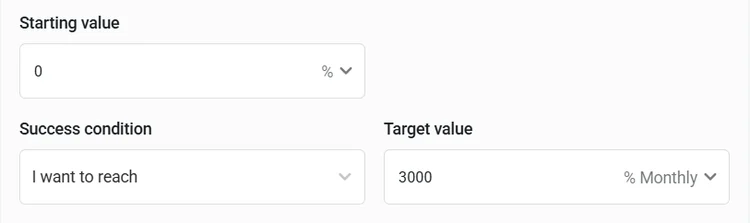 | 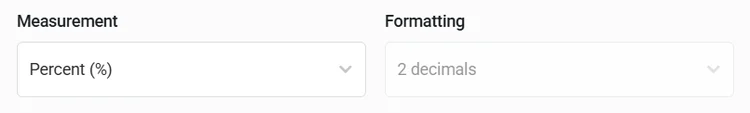 | |
| Use this option when the goal is tied to an existing metric in Databox (for example, GA4 → Sessions). | Use this for offline or qualitative targets that aren't tracked automatically, such as Hire 3 new team members. | Use this when you want to aggregate multiple goals under one higher-level goal or objective. |
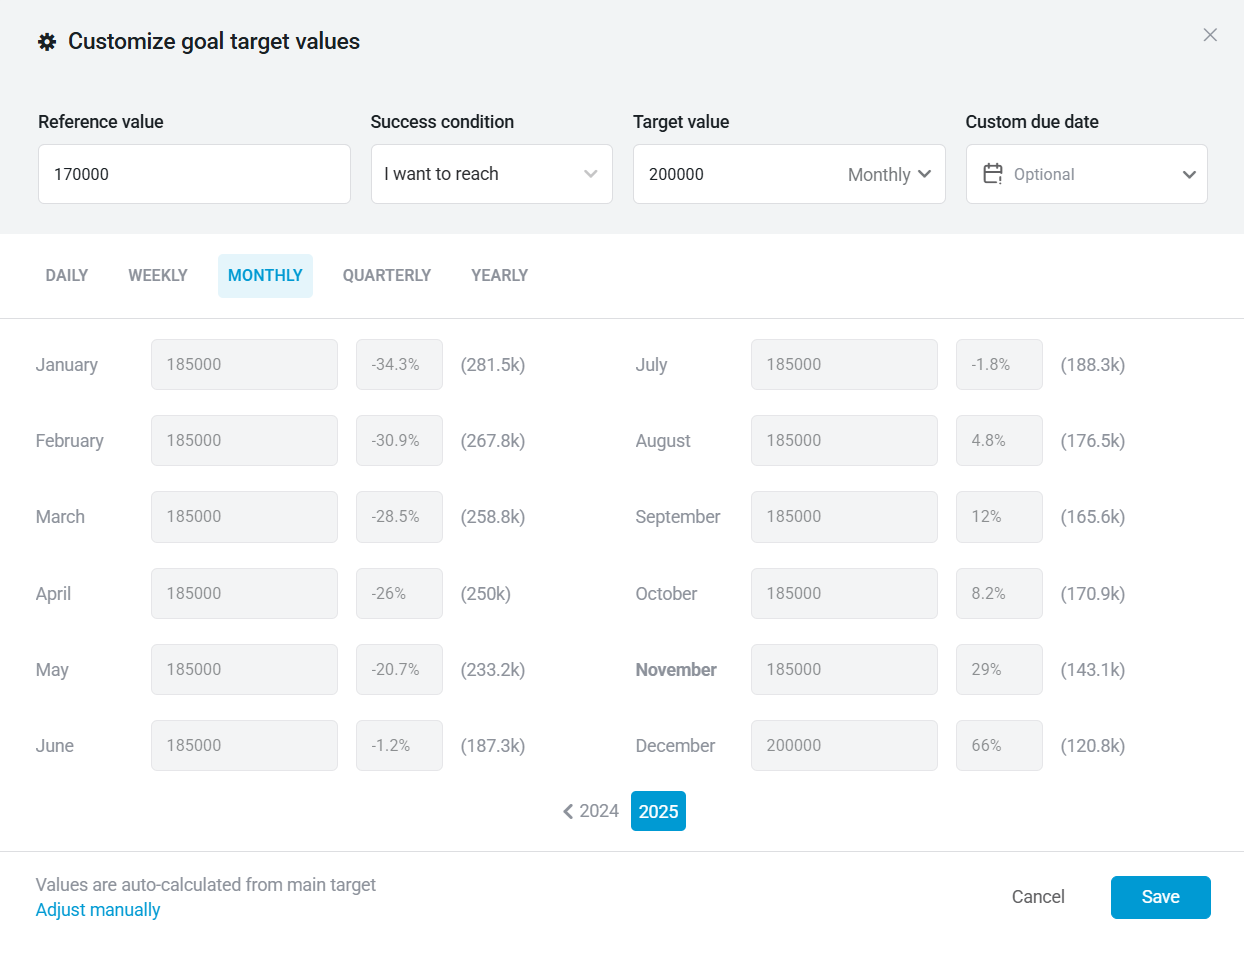
By default, target values apply to the current and future periods. To edit or include values for past periods:
- Click Advanced period settings to open customization options.
- Select Adjust manually in the bottom-left corner.
- Enter the desired values for each period.
- Click Save to confirm your changes.
Use the Status updates controls on a goal's detail page to notify the owner and other users, and to keep progress current. Options vary depending on whether progress is automatic or manual.
- Channels: Email and Slack
- Frequency: Daily, weekly, monthly, quarterly, or on when the goal status changes (e.g., moves to On track, At risk, or Off track)
- Channel: Email
- Frequency: Weekly, bi-weekly, monthly, or quarterly
- Purpose: Reminds the owner to update progress manually
- Weekly: Every Friday at 9 a.m. (account time)
- Bi-weekly: Every other Friday at 9 a.m. (account time)
- Monthly: Last day of the month at 9 a.m. (account time)
- Quarterly: Last day of every third month at 9 a.m. (account time)
You can create an aligned goal directly from the goal details page to link related targets across teams or initiatives.
- On the Goals page, locate the goal you want to align with.
- Click View details.
- On the goal details page, scroll to the Aligned goals section.
- Click + Add goal.
- Follow the instructions in Step 1 to define the goal details and choose how progress is tracked.
Once created, the aligned goal appears in the Aligned goals section of both goals, making it easy to navigate between related targets.
FAQ
Can I create multiple goals for the same metric?
Yes. If the metric includes breakdown dimensions, the goal will apply only to the parent metric or to a specific dimension — if one has been selected.
Can I view client goals in an Agency account?
Yes, navigate to Clients > Goals Overview to see goals from all connected client accounts. Note that goal values are visible only for the date range defined by the goal owner on the Goals page within each individual client account.


