
Databox provides integrations for many popular tools, but you may need to work with data from a source that isn't supported out of the box. With Custom Integration, a configurable connector, you can connect to any external REST API and pull data into a Databox dataset. This gives you the flexibility to bring in custom or internal data, centralize everything in one place, and build metrics tailored to your reporting needs. Once the data is in a dataset, you can create metrics, build Databoards, and track performance just like with any other data source.
Setting up a Custom Integration involves creating a connection, defining how data is requested from your API, transforming the response into a dataset, and choosing how often the data should sync. Follow the steps below to turn raw API responses into structured data you can use in Databox.
A connection stores your API base URL and authentication details. You can reuse one connection across multiple datasets.
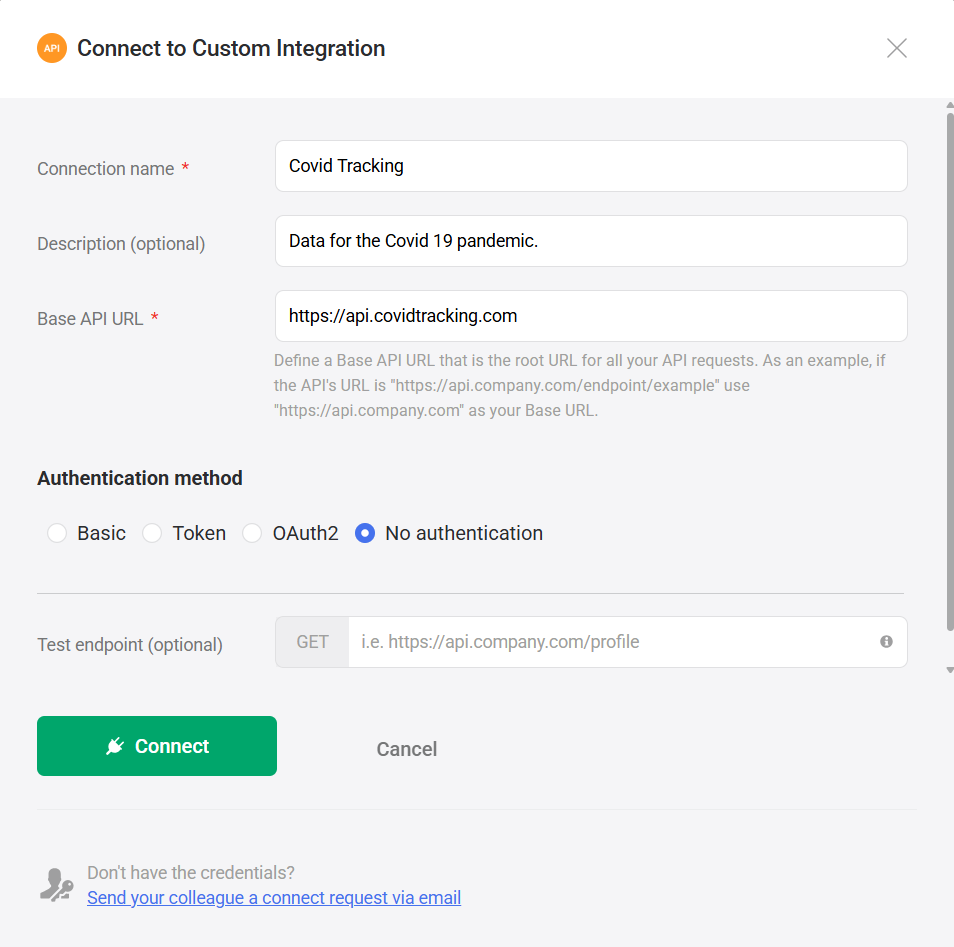
Find Custom Integration and click Connect.
In the dialog, enter the required details:
Connection name — Enter a label to identify the connection.
Description — Add optional notes about the connection.
Base API URL — Enter the root domain of the API (for example,
https://api.company.com).Authentication method — Select one of the following:
- Basic — Use a username and password. Credentials are sent as a standard HTTP Basic Auth header.
- Token — Use an API key or bearer token. Typically sent in the Authorization header or as a custom header.
- OAuth2 — Use OAuth 2.0 credentials. Select a grant type:
- Authorization Code — Redirects you to the provider to authorize access. Best for user-facing APIs that require interactive login.
- Client Credentials — Authenticates using a client ID and secret without user interaction. Best for server-to-server APIs.
- No authentication— Use this for public APIs that do not require credentials.
(Optional) Test endpoint — Enter a sample endpoint to verify that the connection and credentials work.
Click Connect.
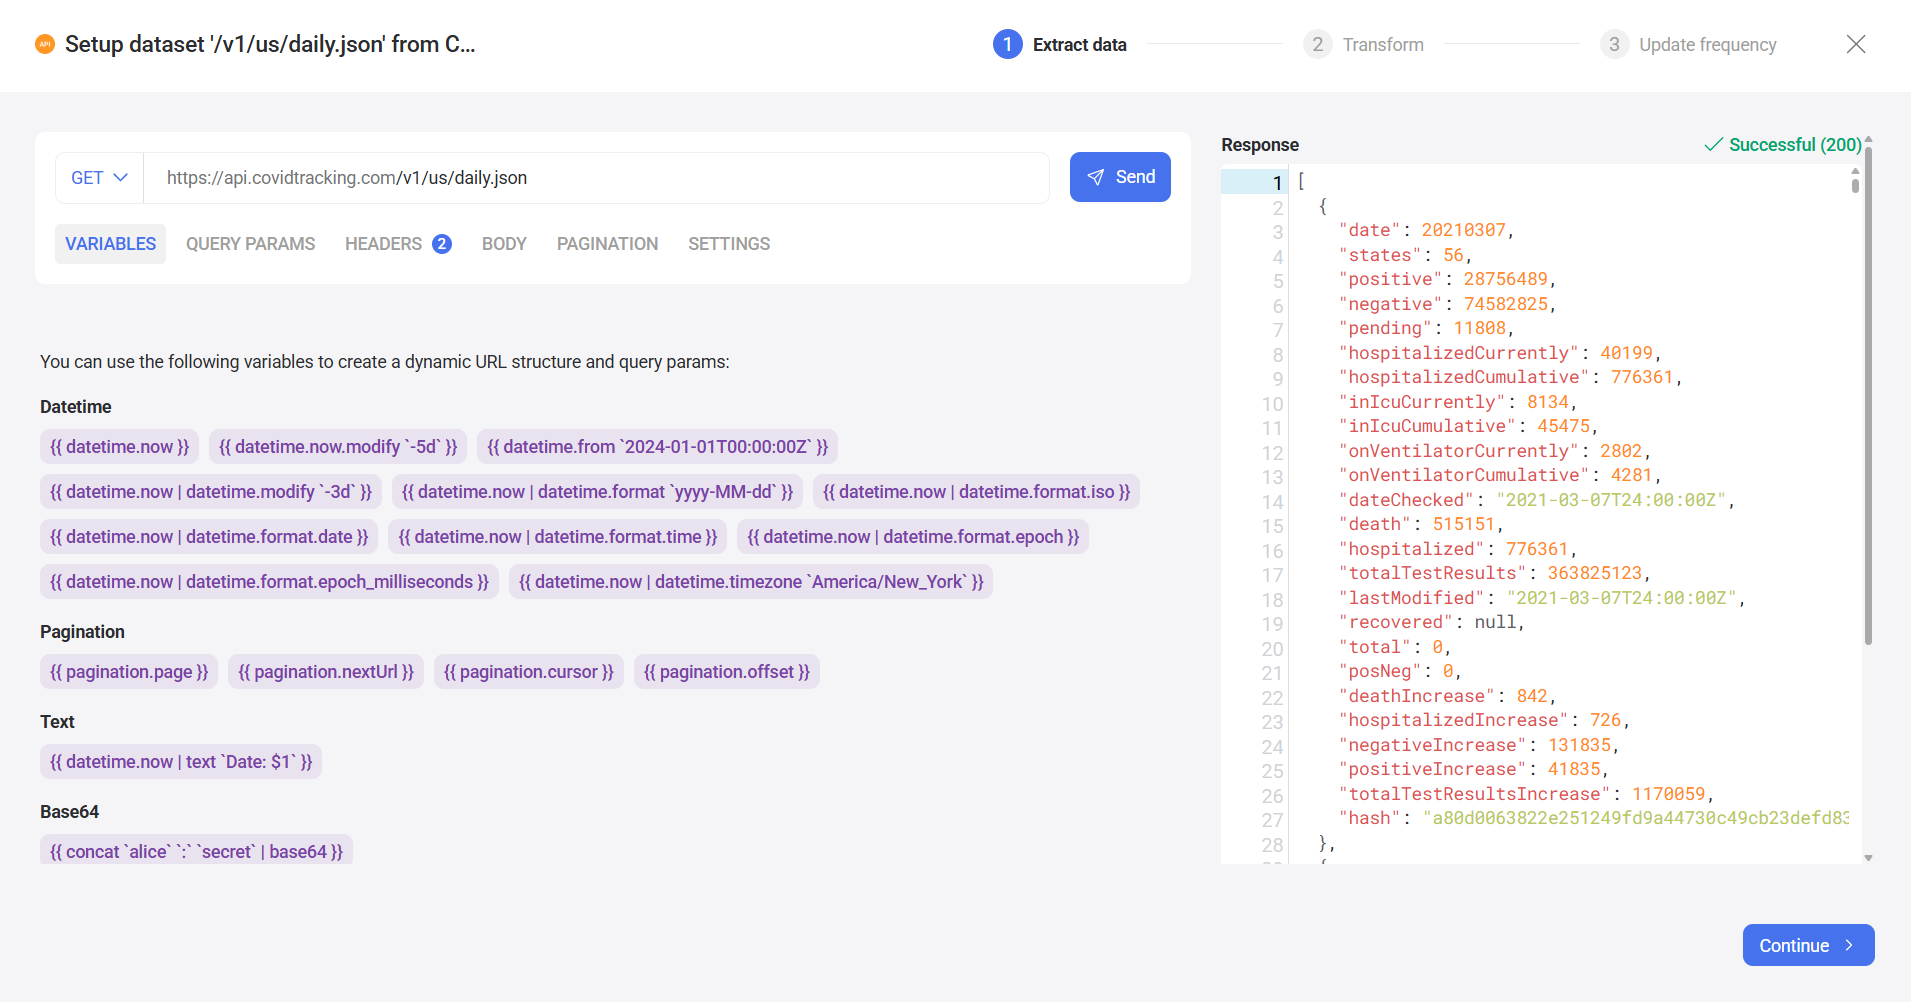
After creating the connection, the dataset setup wizard opens. The first step is to define how Databox should request data from your API.
- Select the HTTP method (for example, GET or POST).
- Enter the endpoint path (for example,
/v1/data). - Use the configuration tabs to refine your request:
- Variables — Shows available variables for dynamic requests, such as dates or pagination. Insert them in the endpoint or any request tab.
- Query params — Add key-value pairs to the request URL.
- Headers — Add custom HTTP headers required by the API.
- Body — Define the request body for POST or PUT requests.
- Pagination — Configure how multiple pages of results are retrieved.
- Settings — Configure time zone handling for API requests and responses, and set rate limit rules to control how many requests are sent within a given time window.
- Click Send to test the request.
A successful request returns a response preview in the right panel. If the request fails, you will see an error message and status code (such as 401, 403, or 500). This usually indicates an issue with the endpoint, headers, parameters, or authentication settings.
Once the request returns the expected data, click Continue.
In this step, you define how the API response is converted into a dataset.
You can choose between two modes:
- Select fields from the JSON response.
- Review the preview table on the right.
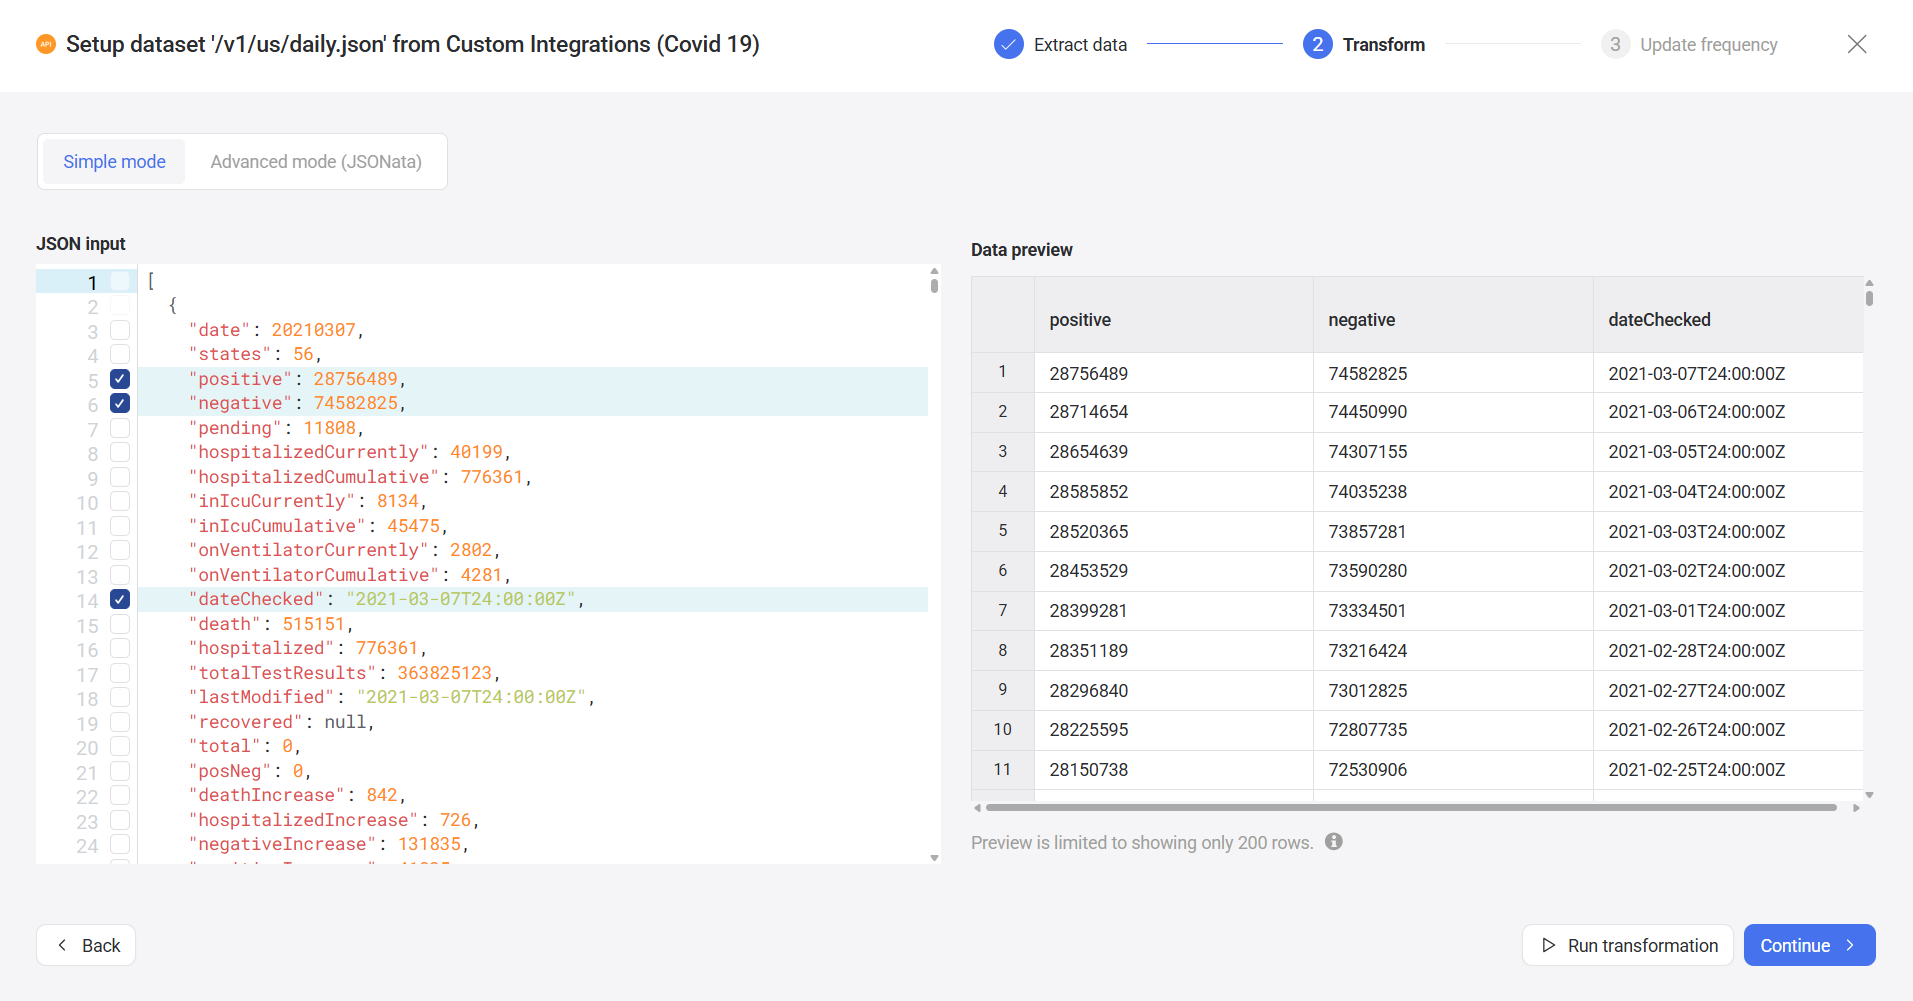
- Edit or write a JSONata expression to extract and structure your data.
- Click Run transformation to preview the result.
The result must return an object or an array of objects, which becomes your dataset.
Click Continue when the output matches your expectations.
Choose how often Databox should sync data from the API and click Finish to create the dataset.
FAQ
Can I connect to APIs that return XML or CSV?
No. The Custom Integration connector currently supports only APIs that return JSON responses.
Can I control API rate limits?
Yes. You can configure rate limits under the Settings tab in the API request builder. Rate limit rules are configured per dataset, not per connection or endpoint — each dataset has its own independent limits, even when sharing a connection or targeting the same endpoint.
If an API returns a 429 error, adding a rate limit rule matching the API's documented limits will help prevent Databox from exceeding them.
Does the dataset accumulate data over time?
No. The dataset does not accumulate or store historical data across syncs. Each sync replaces the existing data with the latest response from the API.
To retain historical data, your API must return it as part of the response. For example, include a date range in your request or use endpoints that provide historical records.
How are errors handled in a Custom Integration?
Error handling is currently limited. If a request fails, you will see an error message and status code in the request preview. It is not possible to detect or handle specific errors at this time.


