
Matomo is a privacy-first web analytics platform used by over 1.4 million websites worldwide. It tracks visitors, actions, referrers, and goals across web and mobile properties, giving teams 100% accurate, unsampled data that they fully own. Connecting Matomo to Databox brings your site analytics alongside data from your marketing, sales, and support tools, so you can monitor traffic sources, measure content performance, and track goal conversions in a single view.
If your credentials don't include full access to the data source, make sure your access level meets any permission requirements listed in the Specification section of the integration's page in the Metric Library.
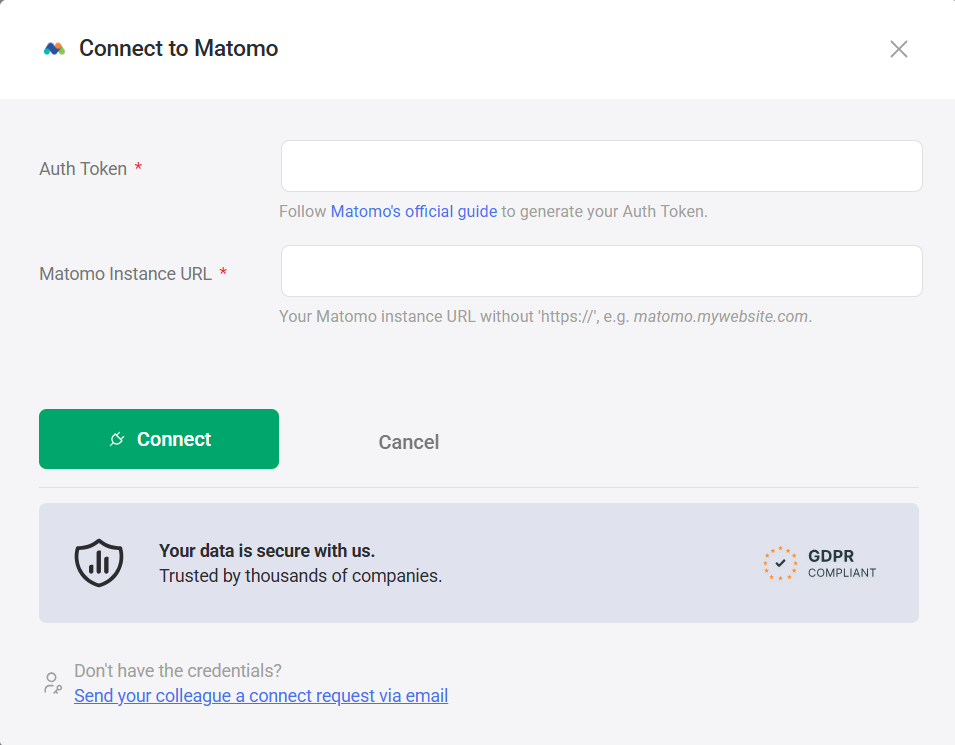
Databox uses a Matomo Auth Token to authenticate the connection. To generate one, follow Matomo's official guide.
- Paste your token into the Auth Token field.
- Enter your Matomo instance address in the Matomo Instance URL field. Use the URL without the
https://prefix (e.g.matomo.mywebsite.com). - Click Connect.
If you've already established a connection, you can reuse it to add new accounts, as long as those accounts are accessible with the existing connection's credentials.
The Matomo integration allows you to create custom metrics using the metric builder, ideal for visualizing data not included in the basic metrics offered by the integration.
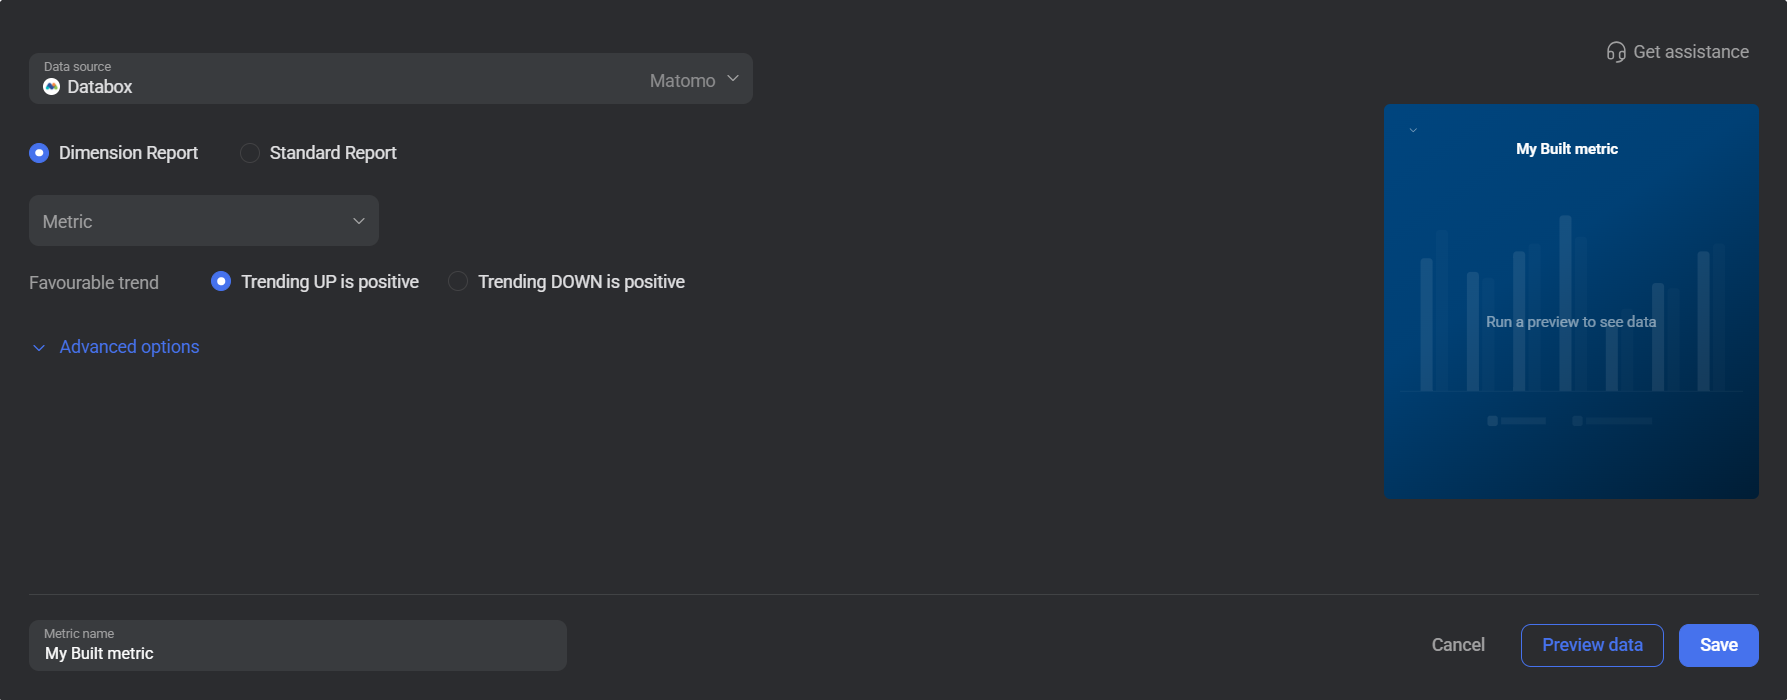
To create a custom metric, start by selecting a report type from the radio buttons at the top of the metric builder — either Dimension Report or Standard Report. Then select a metric from the Metric selector. Next, customize your metric by optionally adding a dimension and applying one or more filters using the Segments section under Advanced options. The available options depend on the selected report type.
The report types accessible for metric creation are listed below.
The Dimension Report lets you measure any Matomo metric broken down by a dimension such as country, device type, or channel type. Use it to answer questions like "How many visits came from organic search?" or "Which pages drive the most actions by country?"
Select a Metric (such as Actions, Visits, or Pageviews) and optionally select a Dimension to segment results. Expand Advanced options to add one or more segment filters: choose an Actions in category, a Name, an Operator, and a Value to restrict the data included in the metric.
The Actions in dropdown groups segments into categories: Acquisition, Behaviour, Events, Visit Location, and Visitors. Selecting a category then exposes the relevant dimension names and operators for that group.
 In Matomo: Go to the Visitors, Behaviour, or Acquisition sections in your Matomo dashboard to explore the dimensions and segments available for your site.
The Standard Report returns a single aggregated metric value for a selected date range, with no dimensional breakdown. Use it to track top-level performance indicators such as total visits, pageviews, or downloads, optionally narrowed by a segment.
Select a Metric (such as Actions, Visits, or Downloads). Expand Advanced options to add segment filters: choose an Actions in category (e.g. Behaviour), a Name (e.g. Exit Page URL), an Operator (e.g. Is), and a Value to filter the results.
In Matomo: Go to the Behaviour section in your Matomo dashboard to browse exit page URLs, page titles, and other behaviour-level dimensions available for filtering.
For comprehensive details on metrics, data availability, templates, specifications, usage guidelines, and other key information, refer to the resources listed below.


FAQ
What happens if I lose my Auth Token after creating it?
Matomo only displays the auth token once, immediately after creation. If you navigate away before copying it, the token cannot be retrieved and you will need to generate a new one. Follow Matomo's official guide to create a replacement token, then update your Databox connection with the new value.
Why are certain entities or properties unavailable in the metric builder?
The metric builder pulls analytics data from Matomo's APIs. If an entity or property is missing, it is likely due to limited API support or technical implementation restrictions. If there's something you'd like to see included, feel free to submit a request, so we can consider it for future updates to the integration.


