
Wistia is a professional video hosting and marketing platform built for businesses that use video to generate leads, nurture prospects, and understand their audience. It provides detailed engagement data — including per-viewer heatmaps, play rates, and drop-off points — alongside lead capture and CRM integrations. Connecting Wistia to Databox brings your video performance data into your dashboards so you can monitor content engagement, track video plays and finishes, and report on audience behavior in context with the rest of your marketing metrics.
If your credentials don't include full access to the data source, make sure your access level meets any permission requirements listed in the Specification section of the integration's page in the Metric Library.
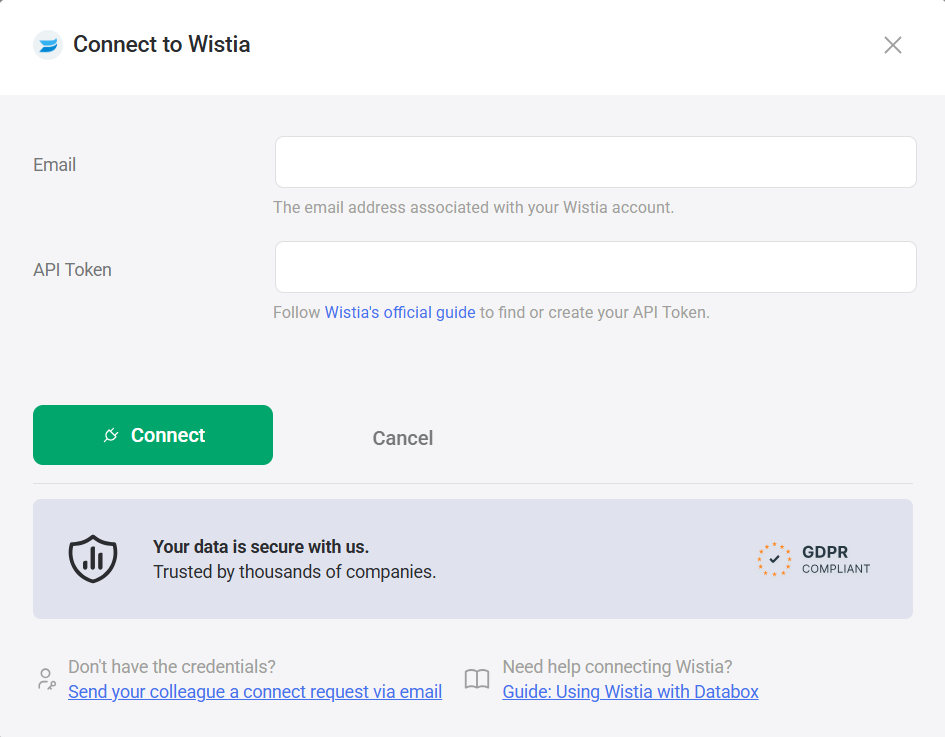
Databox uses an API token to authenticate your Wistia connection.
Follow Wistia's official guide to find or create your API token. After generating the token, copy and store it securely — Wistia does not allow you to copy the token again after you leave or refresh the page.
- Enter the Email address associated with your Wistia account.
- Paste the API token from Step 1 into the API Token field.
- Click Connect.
For comprehensive details on metrics, data availability, templates, specifications, usage guidelines, and other key information, refer to the resources listed below.


FAQ
What happens if my API token is regenerated or deleted?
If your Wistia API token is deleted or becomes invalid, the connection will stop syncing new data. You will need to generate a new API token in Wistia and update your connection in Databox with the new token.


