
Availability
TikTok Ads is a self-serve advertising platform that allows businesses to reach a large and highly engaged global audience through short-form video content across TikTok and its partner networks. It provides tools for campaign management, audience targeting, and performance measurement at the campaign, ad group, and ad level. Connecting TikTok Ads to Databox brings your ad performance data — impressions, clicks, conversions, cost, and more — into a unified reporting environment alongside your other paid channels, so you can monitor spend efficiency and make faster, better-informed decisions.
If your credentials don't include full access to the data source, make sure your access level meets any permission requirements listed in the Specification section of the integration's page in the Metric Library.
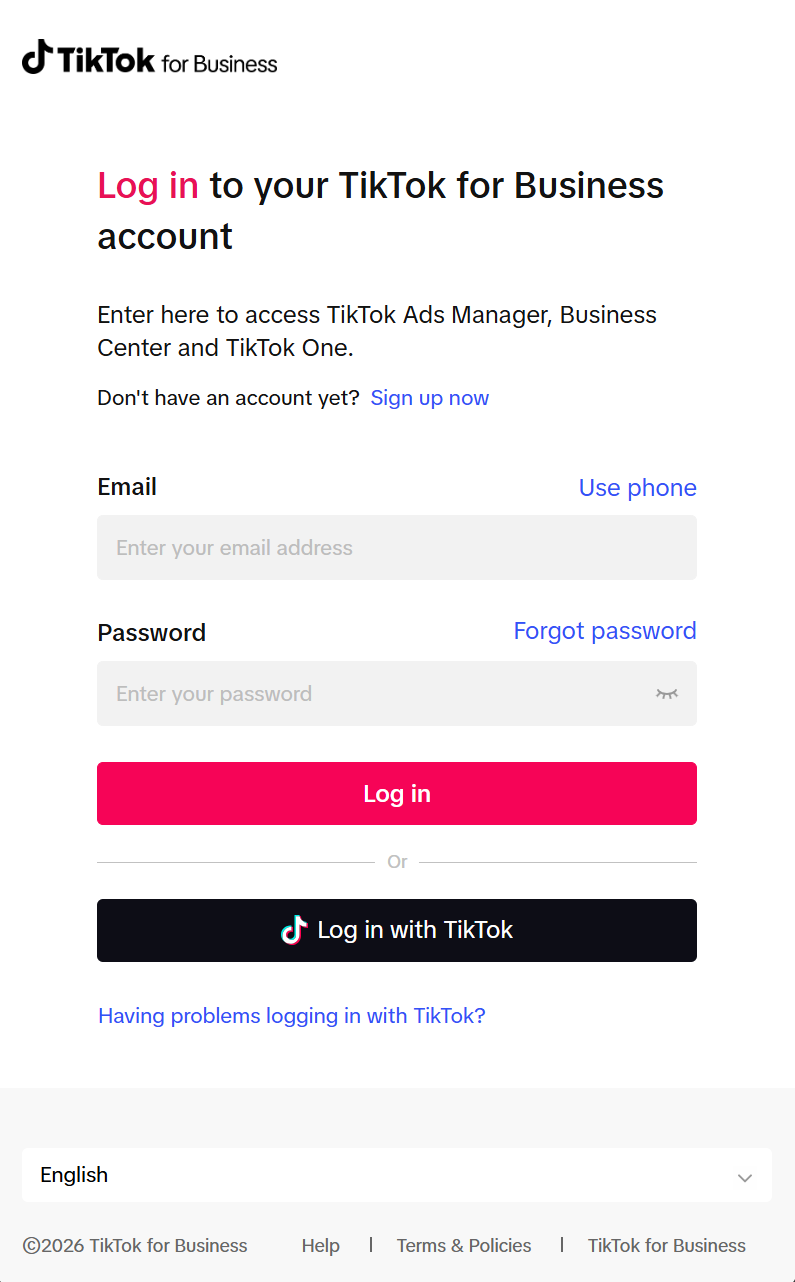
To connect TikTok Ads to your Databox account for the first time, log in using your TikTok for Business credentials. Enter your Email and Password, then click Log in. You can also sign in using the Log in with TikTok option if your personal TikTok account is linked to your TikTok for Business account.
If you've already established a connection, you can reuse it to add new accounts, as long as those accounts are accessible with the existing connection's credentials.
After granting access, select the TikTok advertiser account you want to report on. If you manage multiple advertiser accounts under your TikTok for Business account, you will be prompted to choose the specific account you want to connect to Databox.
The TikTok Ads integration allows you to create custom metrics using the metric builder, ideal for visualizing data not included in the basic metrics offered by the integration.
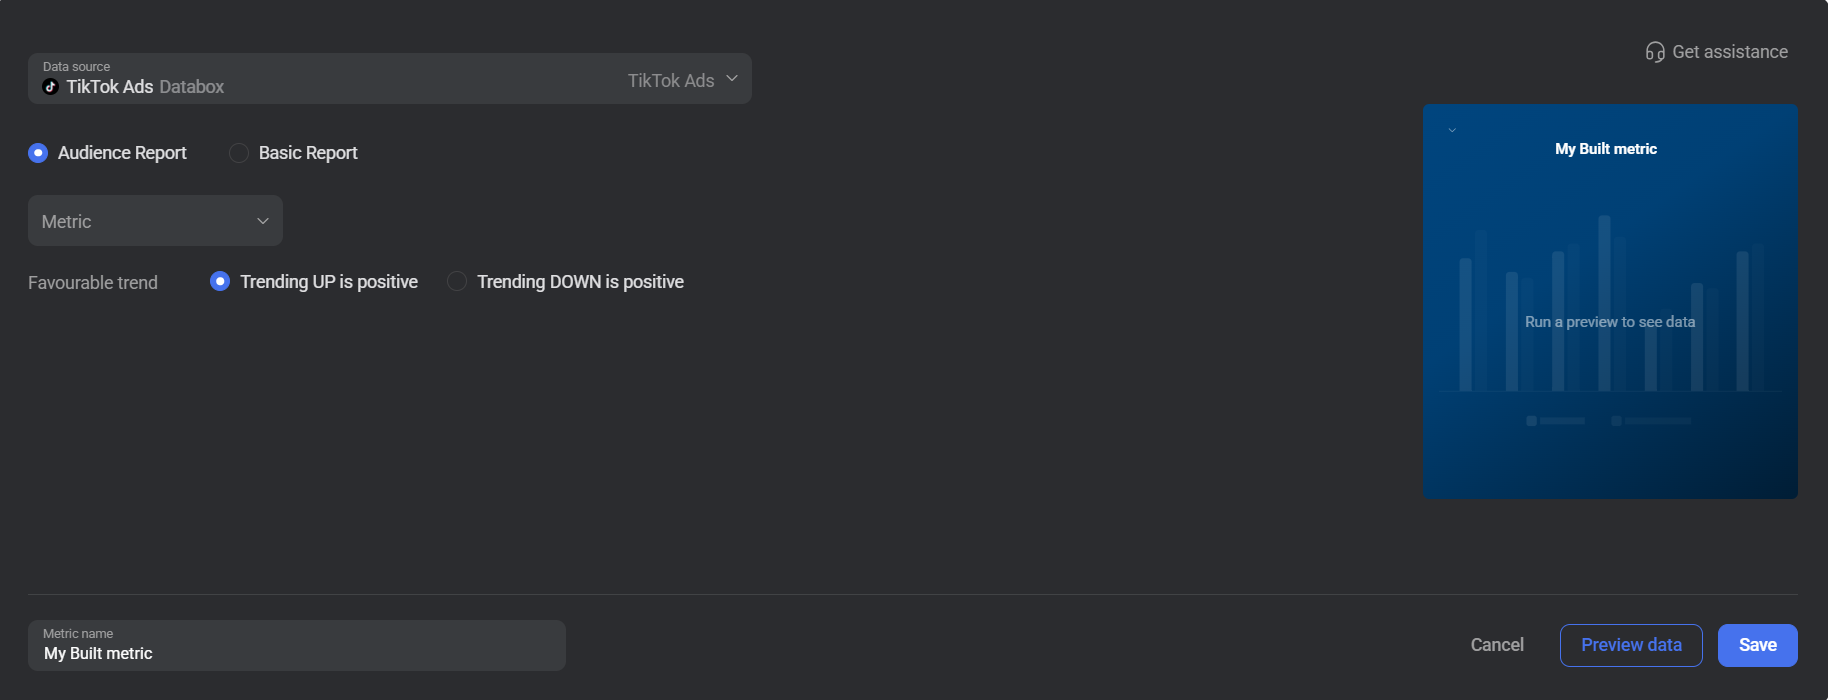
To create a custom metric, start by selecting a metric from the Metric selector. Next, customize your metric by optionally adding a dimension and applying one or more filters. The available options depend on the selected report type and data type (e.g., number, text, etc.).
There are two report types available for custom metric creation: Basic Report and Audience Report.
Audience Report provides performance data segmented by audience characteristics. Select a Metric — options include Total Cost, CPC, CPM, Impressions, Clicks, CTR (%), Conversion, CPA, CVR (%), Result, Cost Per Result, Result Rate (%), and their real-time equivalents.
Then choose one or more Dimensions to break down your data. Available dimensions include Gender, Age, Country Code, Audience Network, Language, Operating System, and Placement. Optionally, select an Extra dimension (Campaign, Adgroup, or Ad) to further segment the report. When an extra dimension is selected, the same Advanced options filter structure as Basic Report becomes available.
 In TikTok Ads: Go to the Ads Manager section.
Basic Report provides access to standard campaign performance data across TikTok's reporting dimensions. Start by selecting a Metric group — options include Basic, Video Plays, Engagements, In-App Events, Attribution, and Page Events — and then choose a specific Metric from the dynamic list loaded for that group.
Optionally, select one or more Dimensions (Campaign, Adgroup, or Ad) to segment your data. When a dimension is selected, Advanced options become available, allowing you to add up to 15 filter groups using AND logic. Available filters depend on the selected dimension:
- Campaign: Filter by Campaign Name, Campaign Type, Campaign Status, or Promotion Type.
- Adgroup: Filter by Campaign Name, Ad Group Name, Ad Group Status, or Promotion Type.
- Ad: Filter by Campaign Name, Ad Group Name, Ad Name, Ad Status, or Promotion Type.
Filter values for name-based filters (Campaign Name, Ad Group Name, Ad Name) are loaded dynamically from your account. Status filters support values such as Active, Not delivering, Inactive, Deleted, Completed, All statuses (including "Deleted"), and All statuses (excluding "Deleted").
In TikTok Ads: Go to the Ads Manager section.

The TikTok Ads integration supports the creation of datasets, which allow you to structure and format your TikTok Ads data for more flexible reporting in Databox. By organizing your data into a tabular format, datasets make it easier to filter, segment, and visualize key metrics across projects, clients, and team members.
The entity relationship diagram (ERD) below illustrates how data is organized within the TikTok Ads integration, displaying the available views and columns, as well as the relationships between them (primary and foreign keys). This diagram represents the schema, or structure, of the data and helps you understand the underlying data model. With this context, you can create datasets using the relevant views and columns to build custom metrics tailored to your reporting needs.
For comprehensive details on metrics, data availability, templates, specifications, usage guidelines, and other key information, refer to the resources listed below.


FAQ
Can I track iOS 14 / SKAN campaigns in Databox?
Yes. When building a Basic Report metric with a Campaign dimension, a Target Audience Type filter is available with the options Regular Campaign and SKAN campaign (iOS 14 campaigns). Select the SKAN campaign option to scope your metric to SKAdNetwork campaign data only.
Why might my TikTok Ads data differ from what I see in TikTok Ads Manager?
Differences can occur due to data attribution windows, time zone settings, or reporting delays. TikTok Ads Manager may apply different attribution lookback windows than the defaults used in Databox metric builder queries. Additionally, TikTok's API may apply a short reporting delay for some metrics, particularly conversion and real-time metrics. Check that the date ranges and attribution settings in both tools are aligned before comparing figures.


