A slide presentation is a versatile tool for organizing and conveying information in a clear, structured format. It allows you to present ideas, data, and insights in a way that is easy for your audience to follow and engage with. By incorporating various content types and design elements, you can tailor the presentation to suit different learning styles and preferences. The flexibility to update and modify content quickly ensures that your presentations remain relevant and accurate.
You can create a presentation in the following ways:
- On the Reports page, click + New Report.
- On the Looped Databoards page, click the down arrow (
 ) and select Create a Report.
 - On the Databoards page, hover over a Databoard, click More, select Add to Report, and then click + Create new Report in the selector.
Once in the report editor, select Slides. In a slide presentation you can:
- Add, reorder, duplicate, or delete slides.
- Name each slide in the bottom left corner.
- Customize the background by changing the color or adding an image.
When creating a presentation, you can choose from six slide types, each designed to present information in a way that suits different viewer preferences and learning styles. These slide types include:
- Cover: For introducing your presentation, featuring an image, header, and introductory text.
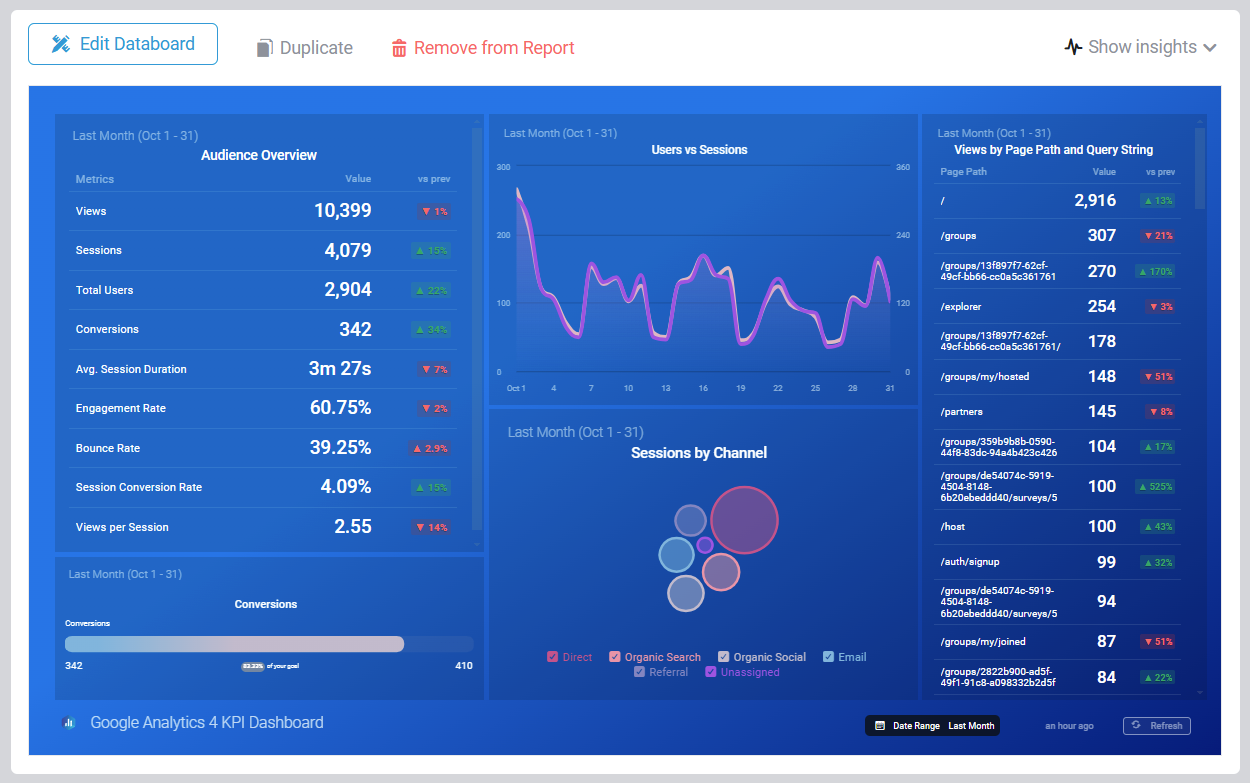
- Databoard: Embeds an existing Databoard, providing a real-time, comprehensive view of multiple metrics.
- 1-3 Columns: Arranges content in 1, 2, or 3 independent columns, each supporting various content elements.
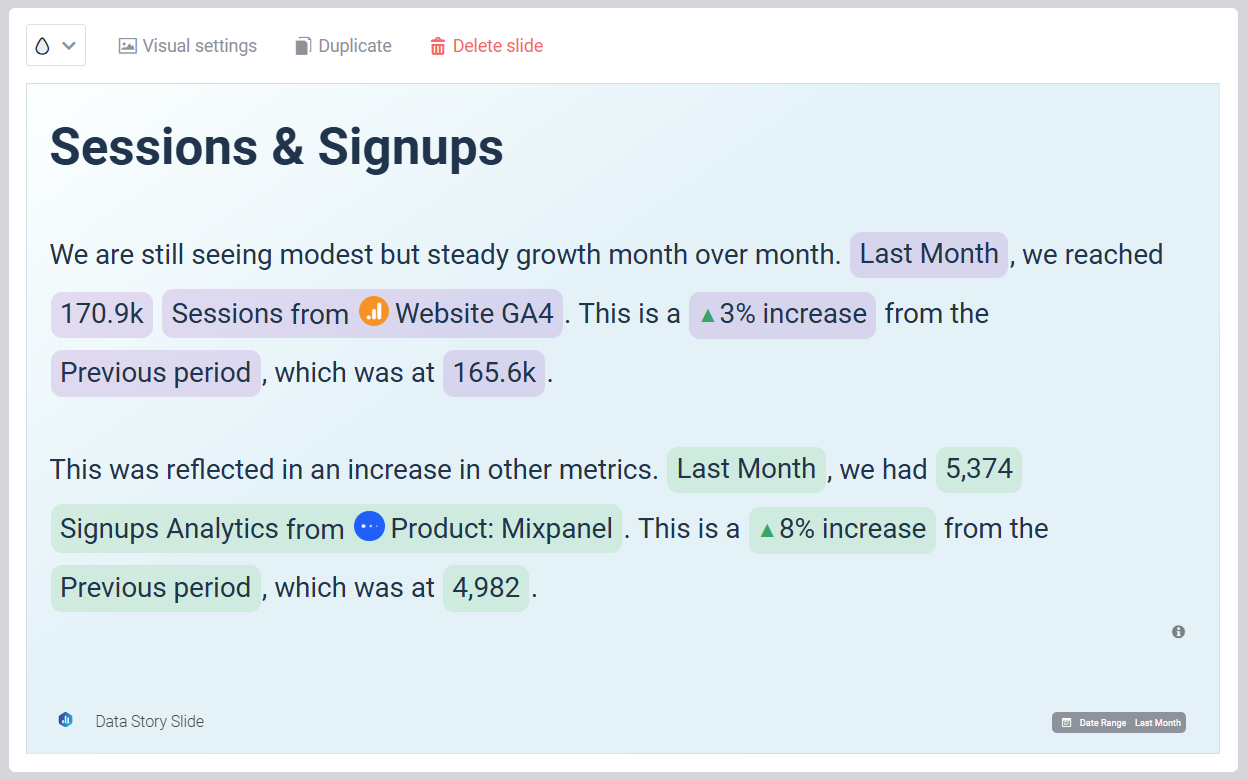
- Data Story: Embeds dynamic data into text, creating a narrative around performance metrics.
Each slide features a resizable Slide Notes section below, where you can add insights or comments about the data. This section will appear in the exported slide, with a 10,000 character limit for the text.
The cover slide serves as the opening page of a presentation, setting the stage for the information that follows. It helps establish a clear, professional first impression and offers viewers a quick preview of the presentation's focus and purpose.
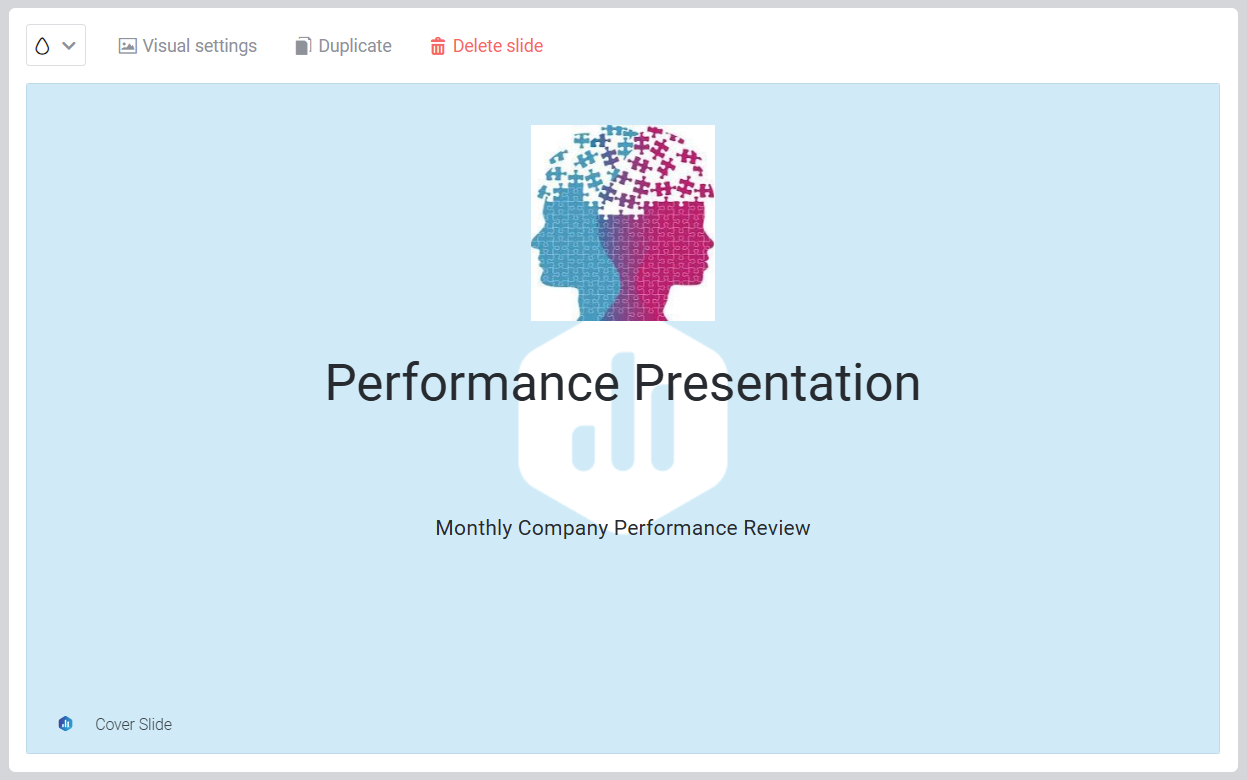
Here's how to make the most of your cover slide:
- Add an image, header, and text to the cover slide
- Include your company logo to reinforce brand identity
- Provide introductory information to set the context for the presentation
- The maximum supported image file size is 10 MB; however, It's recommended to use images no larger than 1 MB to keep the exported presentation size manageable, as larger file sizes can cause issues when attaching the report to an email.
The Databoard slide lets you embed an existing Databoard into the presentation, providing a dynamic way to display multiple metrics and KPIs. It updates automatically with real-time data, ensuring your presentation reflects the most current performance insights and supporting informed decision-making.
For insights into supported features and important notes, refer to this article.

These slides allow you to structure your content using a predefined layout with 1, 2, or 3 columns. Each column functions as an independent section where you can add various elements, such as text, images, or visualizations. This flexibility helps you organize information effectively, ensuring a clear and visually appealing presentation:
For insights into supported content elements, refer to this article.
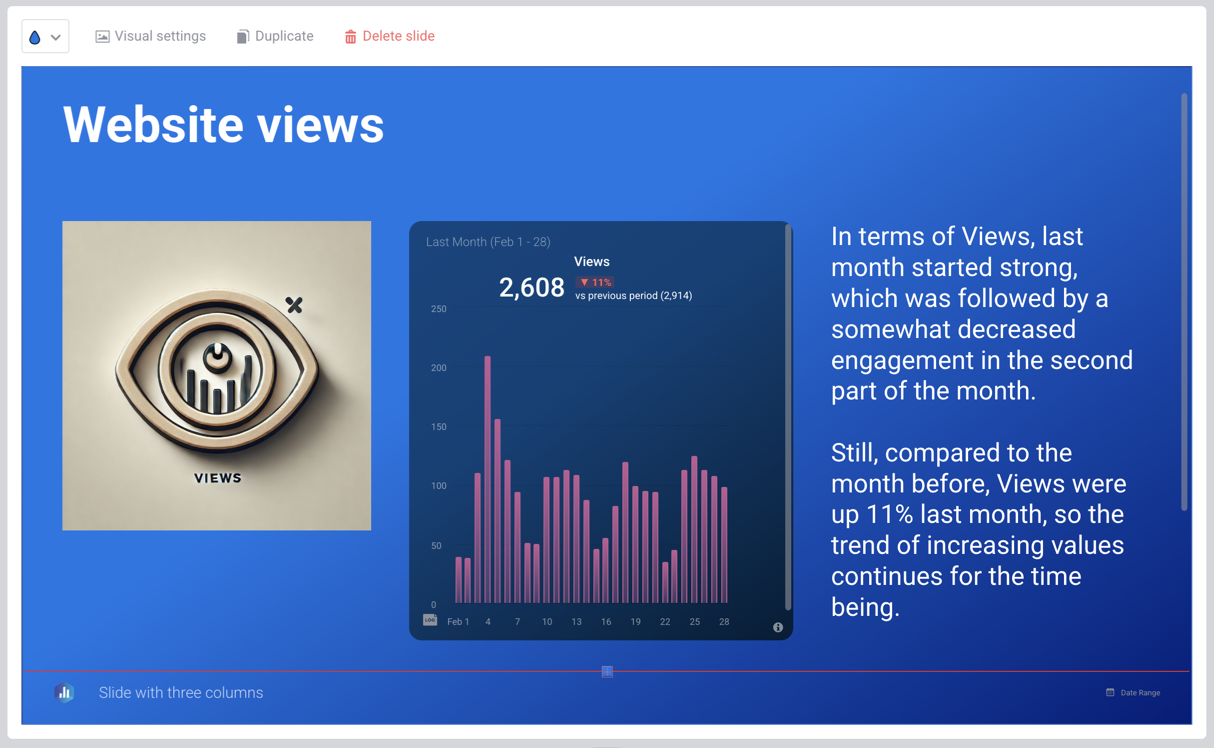
- You can adjust the width of each column individually.
- If your text extends beyond the slide and requires scrolling to view, any overflow text will not appear in the exported presentation.
The Data Story slide lets you embed placeholders (metric elements) within text, which are automatically populated with live data upon visualization or export, allowing you to craft a narrative around the numbers. This feature helps you tell a compelling story with performance metrics, ensuring that your analysis is not only engaging but also always up-to-date.
For insights into supported features and key considerations, refer to this article.
FAQ
Is it possible to change the background color of a Data Story metric element?
Yes. Clicking on the metric element opens the Datablock Editor, where you can choose a background color from a list of predefined options.
Is it possible to copy Data Story content to other slides?
Data Story text can be copied as plain text, but metric elements cannot be copied. To add them to another slide, you must reinsert them using the Data Story control.
What happens to slide titles, notes and background settings if I switch from slide presentation to a single-page report?
Slide titles, notes, and background settings are retained but will remain hidden in a single-page report. When switching back to the slide presentation format, they will be restored, though their alignment with the slide content might vary.
Who can view a slide presentation?
Only users with access to all the Databoards included in the presentation can view it. If they do not have access to any of the Databoards, the presentation will not be visible on their Reports page.


