
Appfigures is an app analytics and reporting platform that aggregates data from major app stores and distribution channels — including iOS App Store, Google Play, Mac App Store, Amazon Appstore, Steam, and more — into a single dashboard. It gives app developers and publishers a unified view of downloads, revenue, ratings, and ad performance across every store where their apps are listed. Connecting Appfigures to Databox brings that store data into your business dashboards alongside marketing, sales, and support metrics, so you can monitor app growth, track revenue trends, and share progress with your team in one place.
If your credentials don't include full access to the data source, make sure your access level meets any permission requirements listed in the Specification section of the integration's page in the Metric Library.
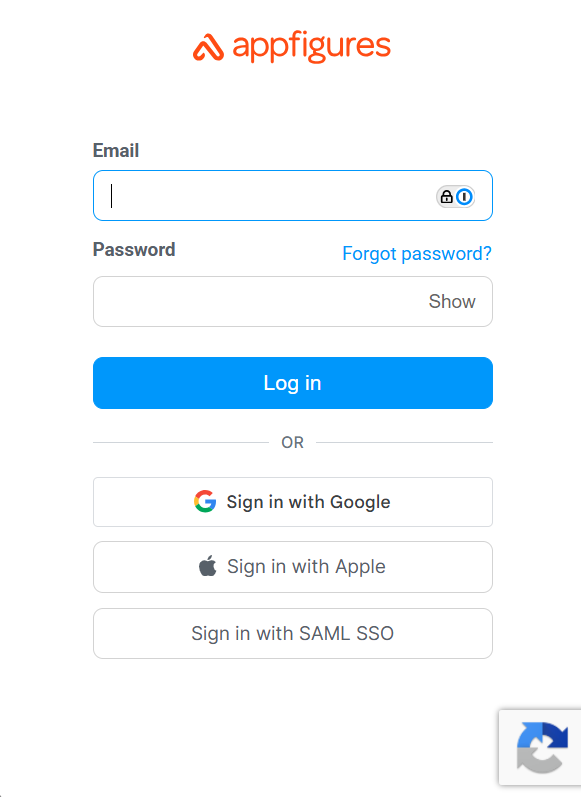
To connect Appfigures to your Databox account for the first time or with new credentials, sign in using your email and password, or use Sign in with Google, Sign in with Apple, or Sign in with SAML SSO.
If you've already established a connection, you can reuse it to add new accounts, as long as those accounts are accessible with the existing connection's credentials.
After signing in, select the Appfigures user account you want to use for this connection.
Select the store you want to pull data from.
Select the app you want to report on.
For comprehensive details on metrics, data availability, templates, specifications, usage guidelines, and other key information, refer to the resources listed below.


FAQ
Why don't I see all my stores or apps in the selection list?
Only stores that are already linked in your Appfigures account appear during setup, and only active apps are shown in the app selection step. If a store or app is missing, verify that it is connected in Appfigures first. You can link a new store by following Appfigures' data source instructions.
Why are some metrics not available for certain sources?
Metric availability varies by store and Appfigures plan. Ads, Ad Spend, and Estimates metrics are not available for Windows Store, Amazon Appstore, or Steam integrations. Subscription metrics are not available for Steam. Estimated Revenue and Estimated Downloads are only available on Appfigures Grow and Explore paid plans — see Appfigures pricing for details.


