
Availability
Pipedrive CRM is a sales management platform designed to help teams organize leads, track deals, and manage customer relationships throughout the sales process. It enables users to monitor activities, visualize pipelines, and follow up on opportunities at the right time, providing clear insights into sales performance and team productivity. Pipedrive also integrates with a wide range of tools, making it easy to connect sales data with existing workflows and reporting processes.
If your credentials don't include full access to the data source, make sure your access level meets any permission requirements listed in the Specification section of the integration's page in the Metric Library.
To connect Pipedrive CRM to your Databox account for the first time or with new credentials:
- Log in to Pipedrive — You'll be prompted to sign in to your Pipedrive account to get started.
- Select the company and user — Choose where the Databox app will be installed.
- Click Allow and Install — This authorizes the Databox app and completes the connection.
The Pipedrive CRM integration allows you to create custom metrics using the metric builder, ideal for visualizing data not included in the basic metrics offered by the integration.
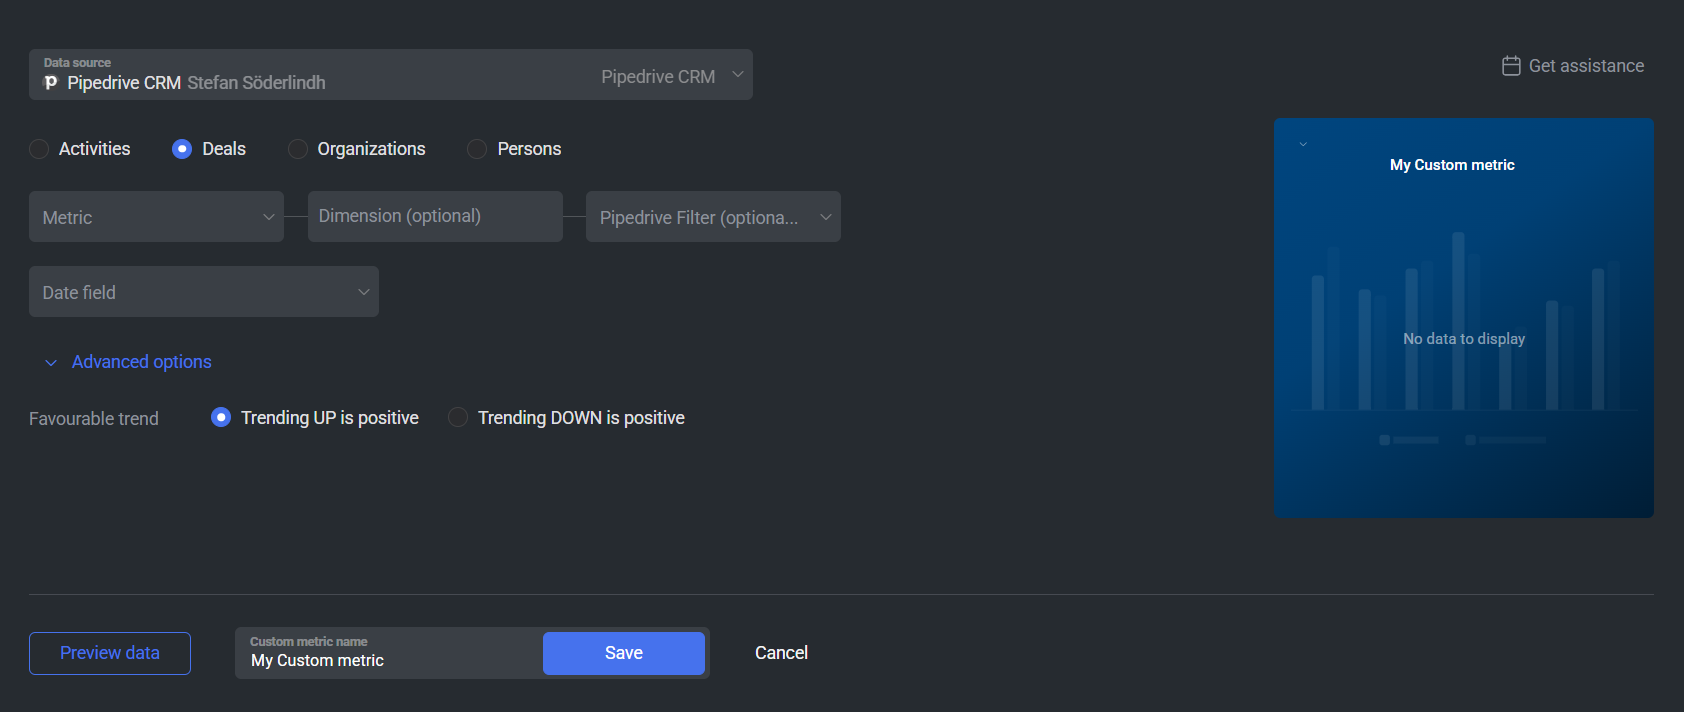
To create a custom metric, start by selecting a metric from the "Metric" selector. Next, customize your metric by optionally adding a dimension and applying one or more filters. The available options depend on the selected entity and data type (e.g., number, text, etc.).
The entities accessible for metric creation are listed below.
Activities represent actions logged in Pipedrive, such as calls, meetings, emails, tasks, and deadlines. Analyzing Activities data helps teams understand sales engagement, follow-up consistency, workload distribution, and overall sales activity levels.
 In Pipedrive: Go to the Activities section.
Deals track sales opportunities as they move through your pipeline, from creation to being won or lost. Deal metrics help teams monitor pipeline performance, revenue trends, deal velocity, win and loss rates, and the total value of closed and open opportunities.
In Pipedrive: Go to the Deals section.
Organizations represent companies associated with deals, activities, and people in Pipedrive. Organization metrics provide insights into account coverage, deal distribution across companies, engagement levels, and how sales performance varies by organization.
In Pipedrive: Go to the Contacts > Organizations section.
Persons are individual contacts stored in Pipedrive, typically leads or customers linked to deals and organizations. Person metrics help teams track contact growth, engagement, activity volume, and how effectively individuals are being followed up throughout the sales process.
In Pipedrive: Go to the Contacts > People section.

The Pipedrive integration supports the creation of datasets, which allow you to structure and format your Pipedrive data for more flexible reporting in Databox. By organizing your data into a tabular format, datasets make it easier to filter, segment, and visualize key metrics across projects, clients, and team members.
The entity relationship diagram (ERD) below illustrates how data is organized within the Pipedrive integration, displaying the available views and columns, as well as the relationships between them (primary and foreign keys). This diagram represents the schema, or structure, of the data and helps you understand the underlying data model. With this context, you can create datasets using the relevant views and columns to build custom metrics tailored to your reporting needs.
For comprehensive details on metrics, data availability, templates, specifications, usage guidelines, and other key information, refer to the resources listed below.


FAQ
Why are certain entities or properties unavailable in the metric builder?
The metric builder pulls raw and analytics data from Pipedrive's APIs. If an entity or property is missing, it is likely due to limited API support or technical implementation restrictions. If there's something you'd like to see included, feel free to submit a request, so we can consider it for future updates to the integration.


