
Availability
X (formerly Twitter) is a social platform used to publish short-form content, engage with audiences, and build brand awareness in real time. Connecting X to Databox lets you track tweet performance, follower growth, and engagement trends alongside your other marketing and business data, so you can monitor your social presence and share results with stakeholders without switching between platforms.
If your credentials don't include full access to the data source, make sure your access level meets any permission requirements listed in the Specification section of the integration's page in the Metric Library.
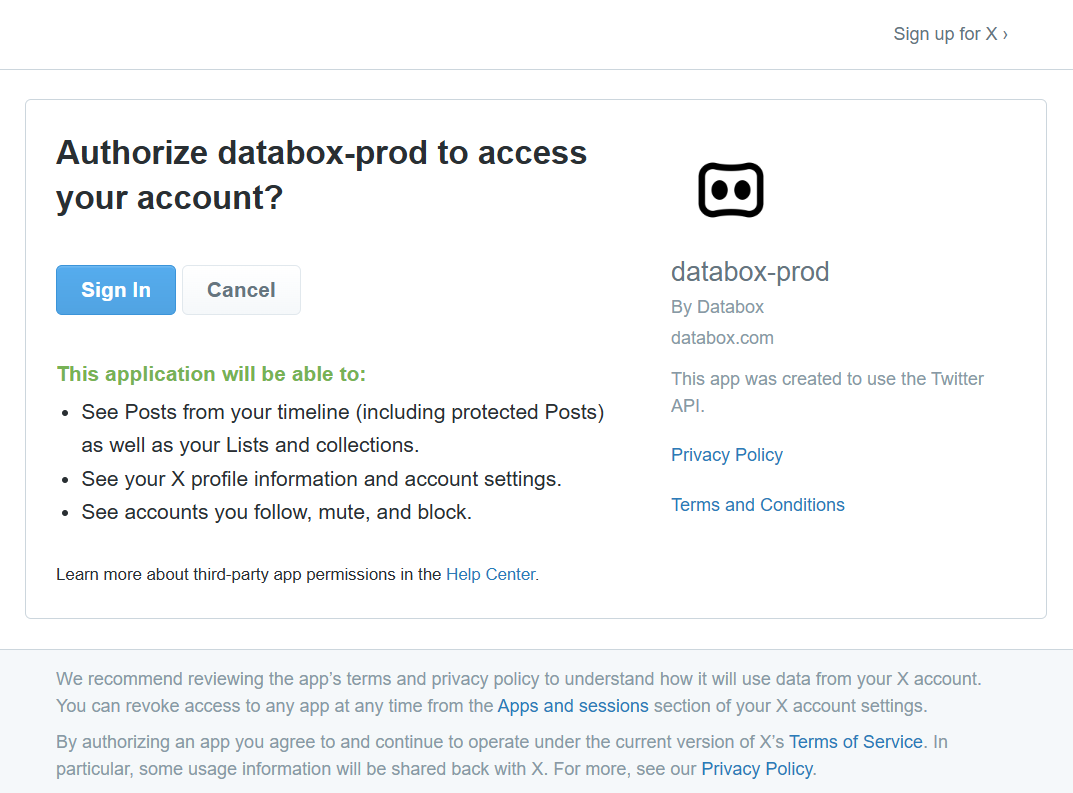
To connect X (Twitter) to your Databox account for the first time, sign in with your phone, Google, Apple, or email/username credentials, then approve the Databox app to grant read-only access to your account data.

The X (Twitter) integration supports the creation of datasets, which allow you to structure and format your X (Twitter) data for more flexible reporting in Databox. By organizing your data into a tabular format, datasets make it easier to filter, segment, and visualize key metrics across projects, clients, and team members.
The entity relationship diagram (ERD) below illustrates how data is organized within the X (Twitter) integration, displaying the available views and columns, as well as the relationships between them (primary and foreign keys). This diagram represents the schema, or structure, of the data and helps you understand the underlying data model. With this context, you can create datasets using the relevant views and columns to build custom metrics tailored to your reporting needs.
For comprehensive details on metrics, data availability, templates, specifications, usage guidelines, and other key information, refer to the resources listed below.


FAQ
What does the timestamp on tweet metrics mean?
Because X allows multiple tweets to have the same text, Databox appends a publication timestamp to each tweet to distinguish them. This ensures that metrics like New Tweets by Retweets Count and New Tweets by Likes Count are attributed correctly to individual tweets rather than aggregated under a shared label.


